Z-Score Calculator
Calculate standardized score
What is a Z-Score?
A Z-Score (also known as a standard score) is a statistical measurement that describes a value’s relationship to the mean of a group of values. Z-score is measured in terms of standard deviations from the mean.
Think of it as a “universal translator” for data.
Imagine you scored 85 on a math test and 90 on a history test. Which did you actually do better on? It’s hard to say if the history test was incredibly easy and everyone scored 95, while the math test was brutal and the average was 60.
A Z-Score standardizes these results so you can compare “apples to oranges.” It tells you exactly where you stand relative to the average, stripping away the units (like “points” or “inches”) to leave you with a pure measure of relative performance.
The Math Behind It
The Z-Score is calculated by taking your raw data point, subtracting the average (mean), and then dividing the result by the standard deviation (the variation in the data).
The formula looks like this:
z = (x - μ) / σ
Where:
- z: The Z-Score
- x: The Raw Score (the value you are testing)
- μ: The Population Mean (the average)
- σ: The Standard Deviation (how spread out the data is)
Why does this matter?
Statisticians use Z-Scores to calculate the probability of a score occurring within a standard normal distribution. It allows researchers to compare scores from different samples (like comparing SAT scores to ACT scores) by normalizing the distribution.
How to Use This Calculator
Using the calculator above is straightforward. You will need three specific data points:
- Enter the Raw Score (x): This is the specific value you are analyzing. For example, your specific test score, or the height of a specific person.
- Enter the Population Mean (μ): This is the average value for the entire group. If you are looking at test scores, this is the class average.
- Enter the Standard Deviation (σ): This measures how spread out the numbers are. A low standard deviation means most numbers are close to the average; a high one means they are all over the place.
Once these are entered, simply click “Calculate Z-Score” to see your standardized result.
Interpreting Your Results
The output tells you how many standard deviations away from the mean your raw score is. Here is how to read the number:
- Zero (0): Your score is exactly the same as the average. You are right in the middle.
- Positive Score (+): Your score is above the average.
- +1.0: You are higher than roughly 84% of the population.
- +2.0: You are higher than roughly 97.7% of the population (exceptional).
- Negative Score (-): Your score is below the average.
- -1.0: You are lower than roughly 84% of the population.
- -1.96: This is often considered the cut-off for “statistically significant” outliers in many studies.
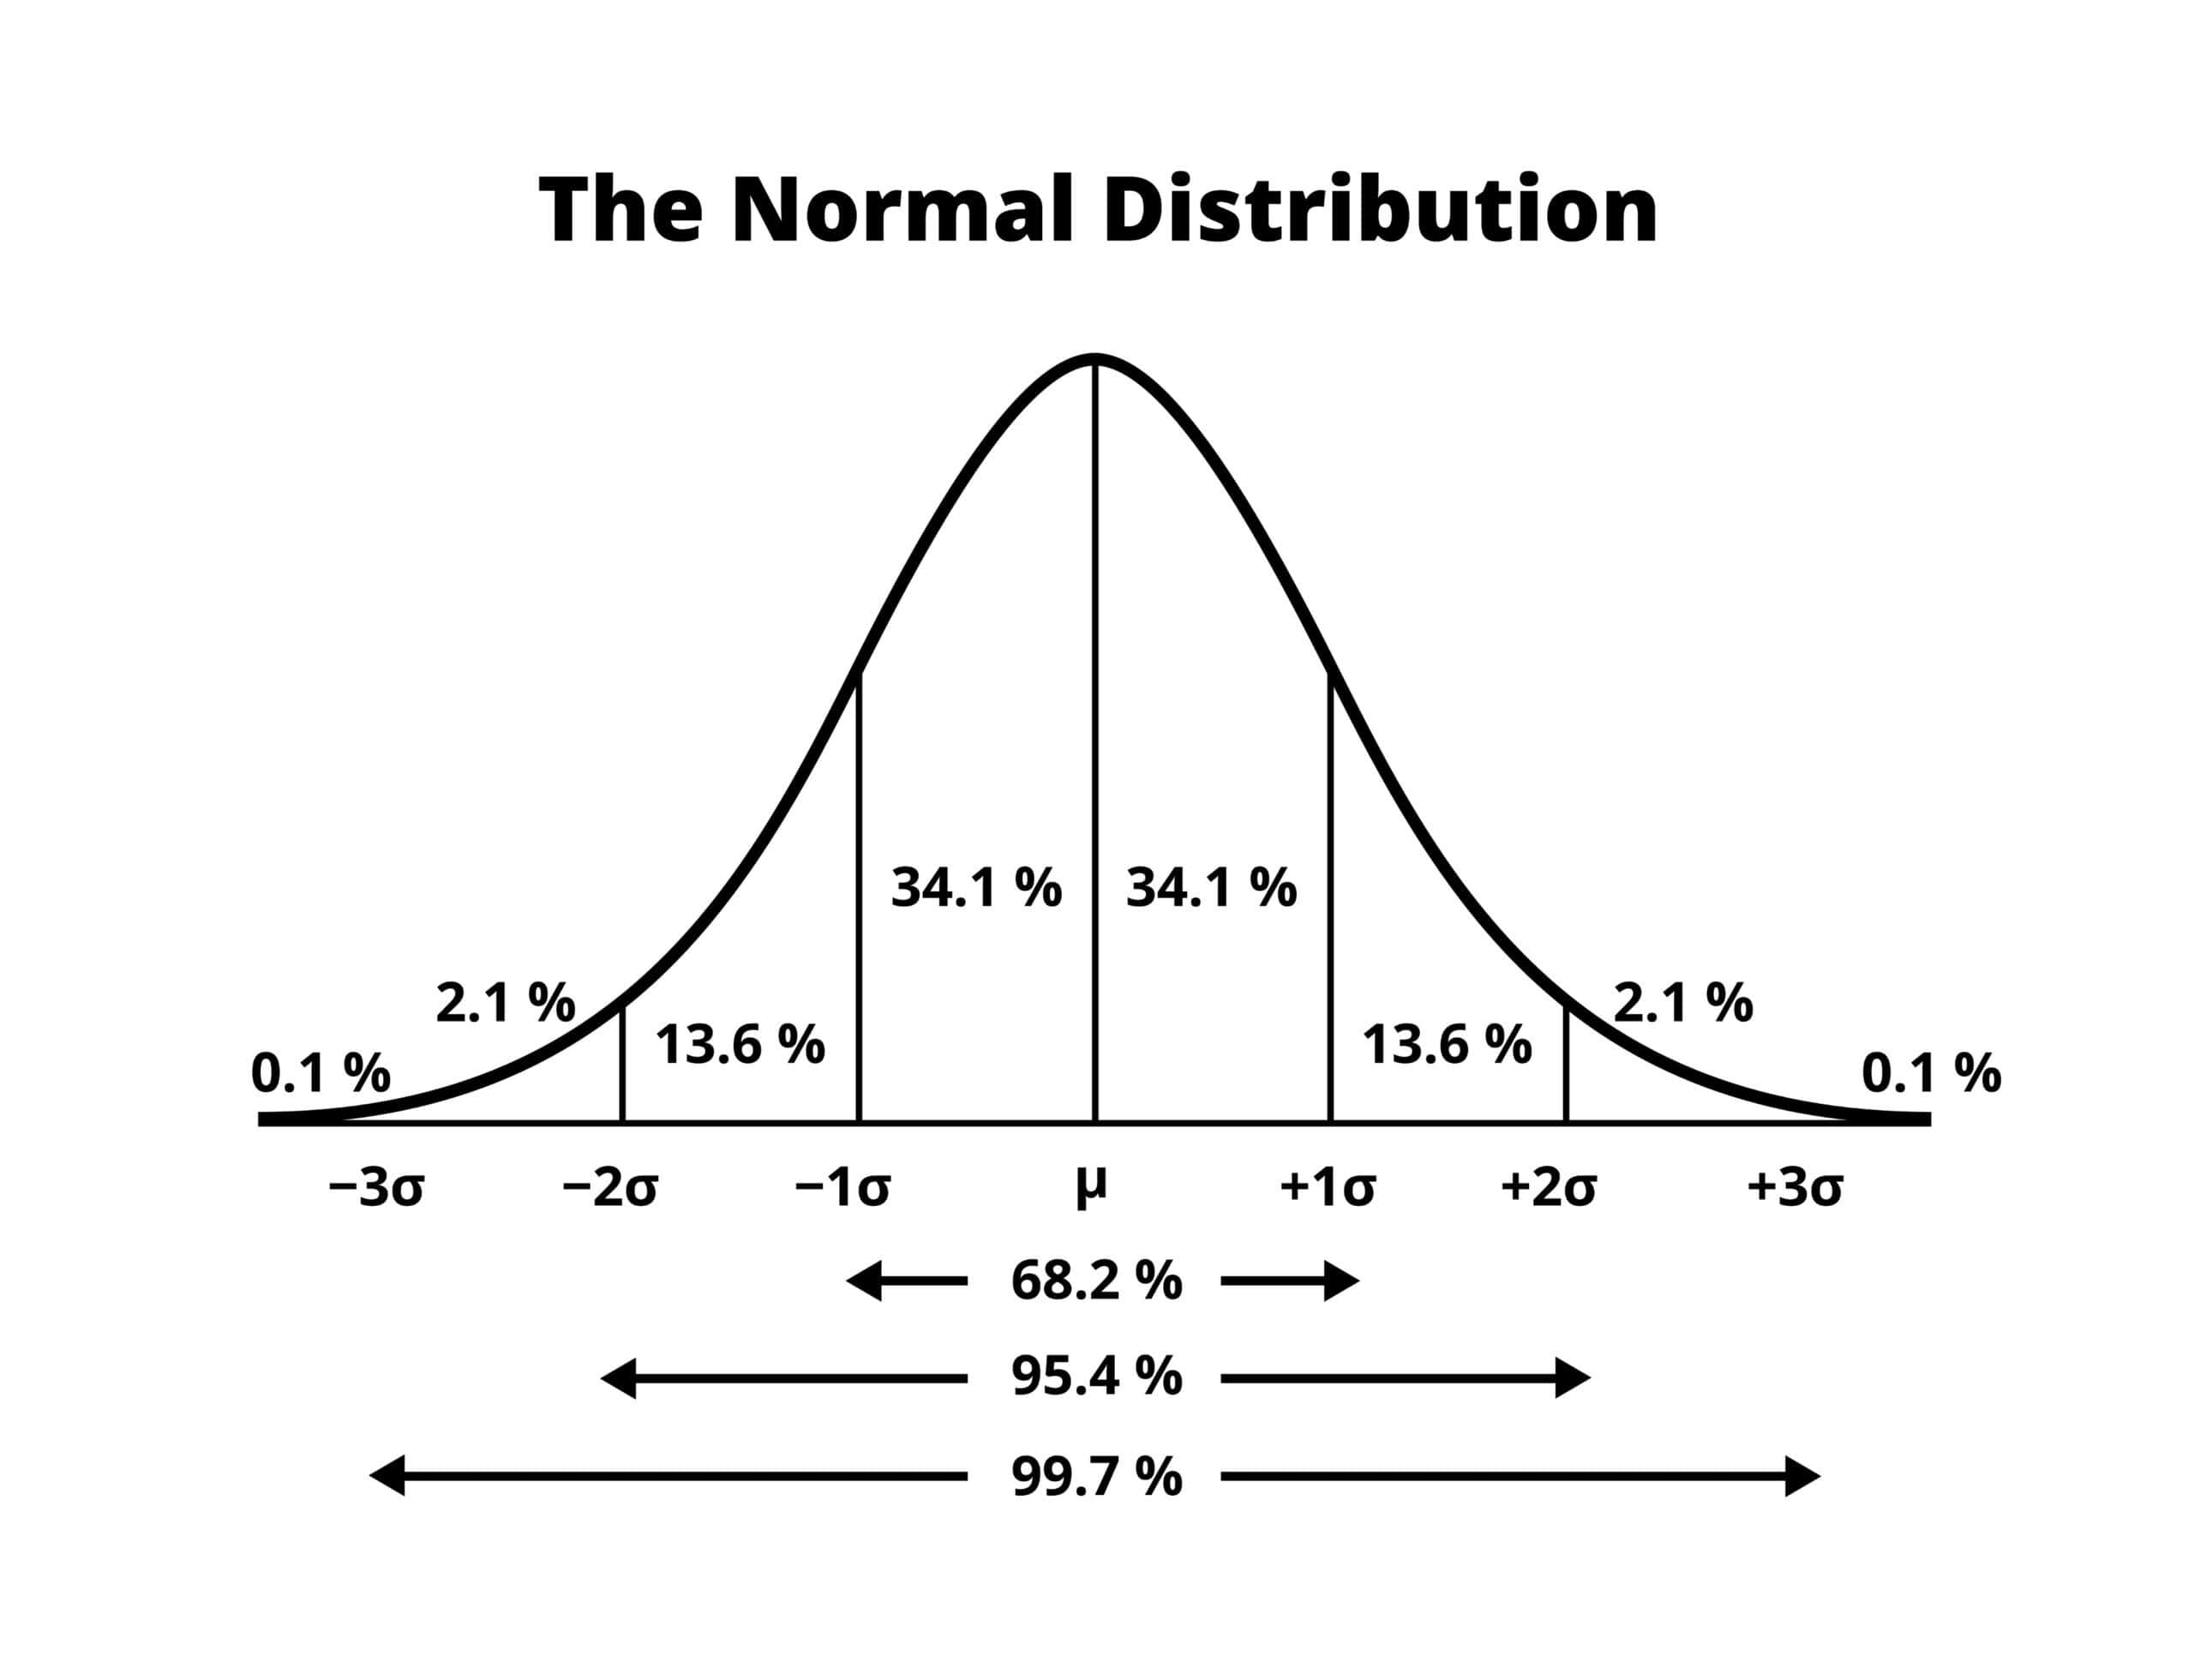
The “Empirical Rule” Benchmark
In a normal distribution (bell curve):
- 68% of values fall between -1 and +1.
- 95% of values fall between -2 and +2.
- 99.7% of values fall between -3 and +3.
Limitations of Z-Scores
While Z-Scores are powerful, they aren’t perfect for every situation. Keep these constraints in mind:
- Assumption of Normality: Z-Scores work best when the data follows a “Normal Distribution” (a bell curve). If your data is heavily skewed (e.g., income data where billionaires skew the average), a Z-Score might be misleading.
- Outlier Sensitivity: Because the calculation relies on the Mean and Standard Deviation, extreme outliers in your dataset can skew those inputs, making the resulting Z-Score less accurate for the rest of the group.
- Population vs. Sample: This calculator assumes you know the parameters for the entire population. If you are working with a small sample size (n < 30), statisticians often use a t-statistic instead of a z-score to account for the uncertainty.
Related Articles / Calculators