
If you want to pull historical stock prices into Excel, the STOCKHISTORY function can return them for a date or date range.
You’ll learn how to build useful historical price tables and handle common STOCKHISTORY issues.
STOCKHISTORY is a dynamic array function. It spills its results across the cells below and beside the formula.
STOCKHISTORY Function Syntax in Excel
The STOCKHISTORY function retrieves historical financial data from Microsoft’s online data service.
=STOCKHISTORY(stock, start_date, [end_date], [interval], [headers], [property0], [property1], [property2], [property3], [property4], [property5])
- stock (required) is the ticker symbol or a cell containing a Stocks data type. You can include an exchange prefix, such as “XNAS:MSFT”.
- start_date (required) is the earliest date to retrieve.
- end_date (optional) is the latest date to retrieve. If omitted, Excel uses the start date.
- interval (optional) controls the frequency. Use 0 for daily, 1 for weekly, or 2 for monthly data. The default is 0.
- headers (optional) controls labels. Use 0 for none, 1 for column headers, or 2 for an instrument row and column headers. The default is 1.
- property0 through property5 (optional) specify the returned fields and their order. Use 0 for Date, 1 for Close, 2 for Open, 3 for High, 4 for Low, and 5 for Volume.
When to Use STOCKHISTORY Function
- Pull daily closing prices for a stock over a fixed date range.
- Summarize historical prices at weekly or monthly intervals.
- Return selected fields such as opening price, daily high, daily low, closing price, and volume.
- Build side-by-side price tables for two or more securities.
- Retrieve the last available closing price on or before a specified date.
Example 1: Get Daily Closing Prices
Let’s start with the shortest STOCKHISTORY formula.
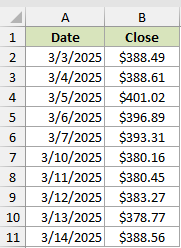
Below is the dataset returned for Microsoft stock. It contains Date and Close columns for March 3 through March 14, 2025.
We want Excel to return every available daily closing price within that date range.
Here is the formula:
=STOCKHISTORY("MSFT",DATE(2025,3,3),DATE(2025,3,14))
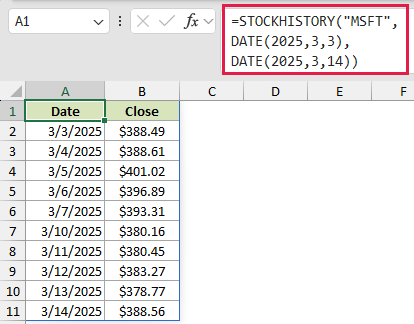
The ticker, start date, and end date are the only arguments supplied. Excel therefore uses daily data, includes headers, and returns Date and Close.
The formula spills from A1 through B11. At the time of writing, the closing prices run from $388.49 on March 3 to $388.56 on March 14.
Only completed trading days appear. March 8 and 9 were weekend dates, so Excel leaves them out instead of returning blank rows.
Example 2: Return Weekly Stock Prices
For a broader view, switch the interval and include an instrument label.
Below is the dataset returned for Apple stock. It has an instrument row, Date and Close headers, and eight weekly observations.
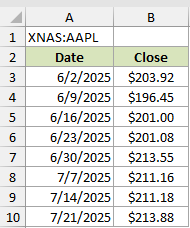
We want weekly closing prices from June 2 through July 25, 2025, with both available header levels.
Here is the formula:
=STOCKHISTORY("AAPL",DATE(2025,6,2),DATE(2025,7,25),1,2)
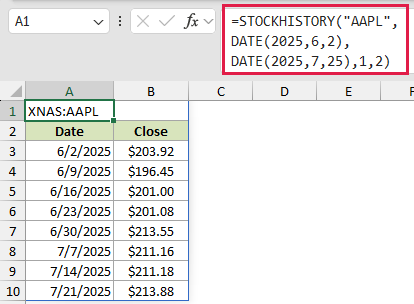
The fourth argument is 1, so Excel returns weekly data. The fifth argument is 2, which adds the instrument name above the column headers.
The table starts with a $203.92 close for June 2 and ends with $213.88 for July 21.
Weekly and monthly dates follow Excel’s interval boundaries. A returned date can therefore fall before the exact start date you entered.
Example 3: Choose Stock Data Fields
Here’s how to return more than the default Date and Close fields.
Below is the dataset returned for Nvidia stock. It contains Date, Open, High, Low, Close, and Volume columns for ten completed trading days.
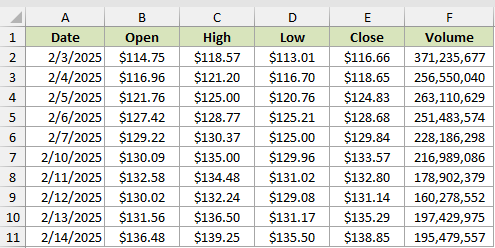
We want daily prices and trading volume arranged in a specific column order.
Here is the formula:
=STOCKHISTORY("NVDA",DATE(2025,2,3),DATE(2025,2,14),0,1,0,2,3,4,1,5)
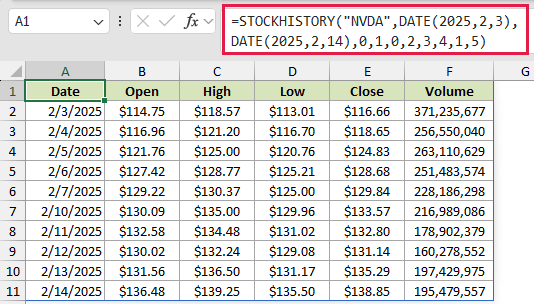
The 0 interval requests daily data, while the 1 header setting includes column names. The remaining numbers are property codes.
Excel returns the properties in the order listed: Date, Open, High, Low, Close, then Volume. February 3 closed at $116.66.
Pro Tip: You don’t need to request every property. List only the codes you need, and place them in the order you want the columns to appear.
Example 4: Calculate Monthly Price Ranges
Let’s use cells for the inputs and calculate something from the spilled results.
Below is the dataset. Cells B1:B4 hold the formula inputs. The table beginning in A6 contains monthly highs, lows, and calculated ranges.
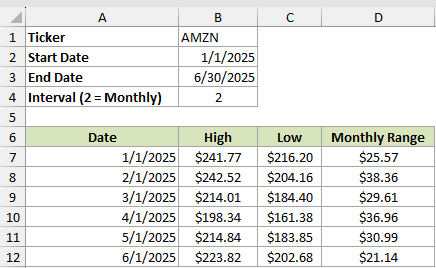
We want monthly Amazon highs and lows, then the difference between them for each month.
Here is the STOCKHISTORY formula:
=STOCKHISTORY(B1,B2,B3,B4,1,0,3,4)
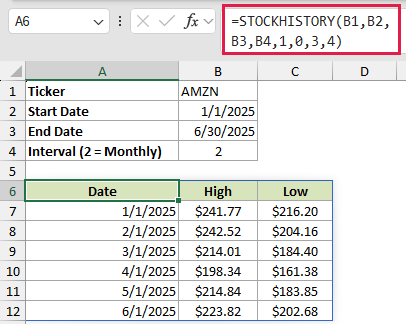
The formula reads its first four arguments from B1:B4. Property codes 0, 3, and 4 return the Date, High, and Low columns.
The result spills from A6 through C12. January’s high is $241.77 and its low is $216.20.
To calculate the monthly range, enter this formula in D7 and copy it down through D12:
=B7-C7
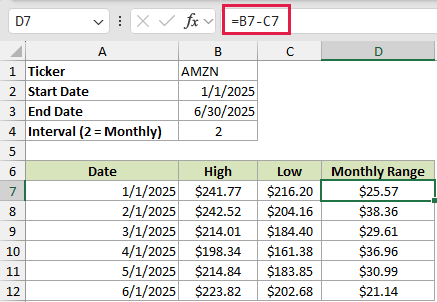
Each row subtracts the monthly low from the monthly high. January’s range is $25.57, while February’s is $38.36.
Using cells for the inputs makes the report easy to update. Change the ticker, date range, or interval, and the historical table refreshes.
Pro Tip: Keep the cells beside and below the spill area empty. Existing content in that space causes a #SPILL! error.
Example 5: Compare Two Stocks Side by Side
This time, we’ll combine two STOCKHISTORY results into one table.
Below is the dataset. Column A contains trading dates, while columns B and C contain Microsoft and Apple closing prices.
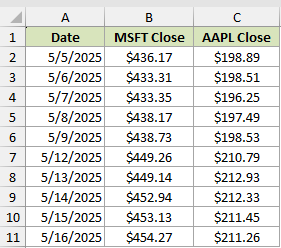
We want one spilling formula to align both stocks across the same ten trading days.
Here is the formula:
=HSTACK(STOCKHISTORY("MSFT",DATE(2025,5,5),DATE(2025,5,16),0,0,0,1),STOCKHISTORY("AAPL",DATE(2025,5,5),DATE(2025,5,16),0,0,1))
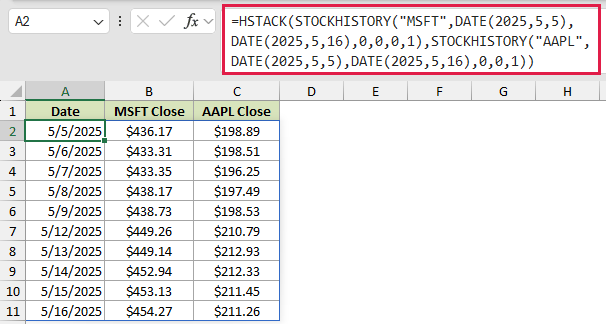
The first STOCKHISTORY call returns Date and Close without headers. The second returns only Close, also without headers.
HSTACK places those arrays beside each other under the labels already in row 1. Both series run from May 5 through May 16.
This method assumes both securities have matching trading dates. Different market holidays can misalign rows, so check the dates when comparing securities from different exchanges.
Example 6: Handle a Weekend Date
Finally, let’s handle a date when the market was closed.
Below is the dataset. B1 contains the MSFT ticker, and B2 contains March 8, 2025, which was a Saturday.
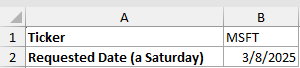
We first want to see what happens when the requested start and end dates are both a weekend.
Here is the direct formula:
=STOCKHISTORY(B1,B2,B2,0,0,1)
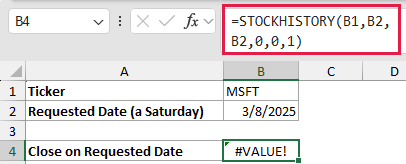
The formula returns #VALUE! because March 8 was not a completed trading day. STOCKHISTORY has no price row to return for that date.
Instead, we want the most recent closing price on or before the requested date.
Here is the fallback formula:
=TAKE(STOCKHISTORY(B1,B2-4,B2,0,0,1),-1)
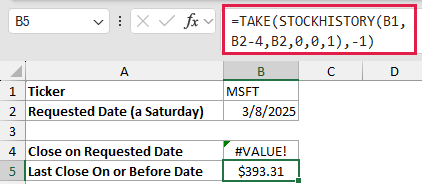
The inner STOCKHISTORY call retrieves closes from the four days before B2 through B2. TAKE returns the last row in that result.
The formula returns $393.31, the closing price from Friday, March 7, 2025.
Pro Tip: Extend the lookback beyond four days when a long market closure could occur. The formula needs at least one completed trading day in its date window.
Tips & Common Mistakes
- STOCKHISTORY requires a qualifying Microsoft 365 subscription and an internet connection. It relies on the same Stocks data service as the Stocks data type.
- #BUSY! is a temporary placeholder while Excel fetches the data. It normally resolves when the online request finishes.
- STOCKHISTORY returns historical data only for completed trading days. Use the Stocks data type when you need a current price instead.
- A weekend, market holiday, or unknown ticker can return #VALUE!. Check the ticker and dates before changing the formula.
- Use DATE for typed dates, as shown in these examples. Text dates can be interpreted differently under another regional setting.
- You can add an exchange prefix to remove ticker ambiguity, such as “XNAS:MSFT”. STOCKHISTORY can also accept currency pairs such as “USD:EUR”.
- Weekly and monthly intervals can start at an interval boundary before your requested start date. Check the returned Date column instead of assuming the first label.
- Because STOCKHISTORY spills, content in its output area causes #SPILL!. Clear the blocked cells rather than copying the formula down.
STOCKHISTORY can build a historical price table from one formula, including the fields and interval you choose.
The key is choosing arguments that return a clean table your worksheet can use directly.
Related Excel Functions / Articles:
