
Excel’s STDEV.P function returns the standard deviation for an entire population.
It measures how widely values spread around their mean in the original units.
A lower standard deviation means the population values sit closer together.
In this article, I’ll show you how to measure population variation, compare STDEV.P with STDEV.S, and calculate standard deviation for a selected group.
STDEV.P Function Syntax in Excel
STDEV.P requires one numeric argument and accepts up to 253 more.
=STDEV.P(number1, [number2], ...)
number1is the first number, range, array, or reference for the population.number2, through argument 254, are optional additional numbers, ranges, arrays, or references from the same population.
When to Use STDEV.P Function
- Measure variation when the listed values are the complete population of interest.
- Compare consistency across complete groups or processes.
- Calculate population spread for one filtered segment.
- Combine several complete ranges into one population calculation.
- Report variation in the same units as the source data.
Example 1: Calculate Population Standard Deviation
This example measures output variation across every packing station in one full shift.
Below is the dataset with all eight station totals and an empty population-standard-deviation result cell.
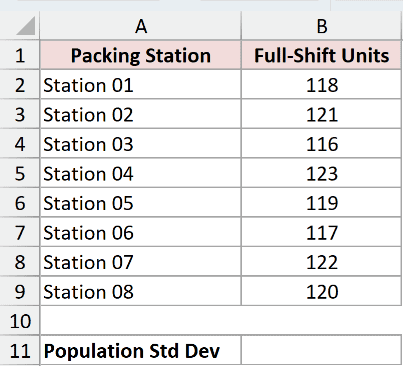
We want to measure the spread across this complete set of station totals.
Here is the formula:
=STDEV.P(B2:B9)
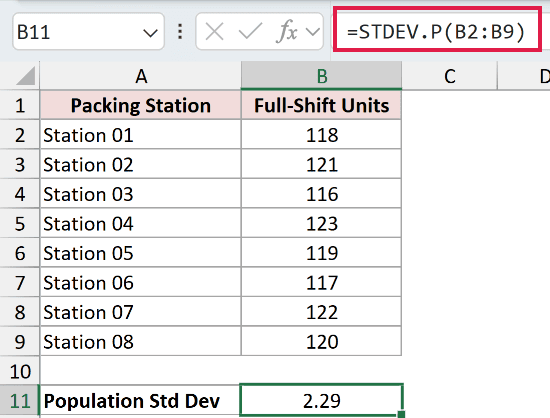
The population standard deviation is 2.29 units. That describes the variation across all eight stations included in the shift report.
Pro Tip: Define the population before choosing the function. A complete shift can be a population even when it represents only one day.
Example 2: Compare STDEV.P and STDEV.S
The right function depends on whether the values are a population or a sample.
Below is the dataset with on-time deliveries for every hub in the reporting group and two empty result cells.
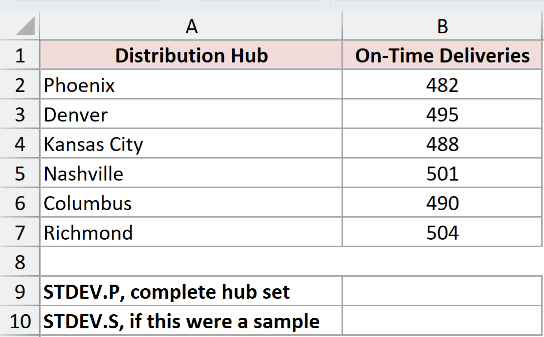
We first want the standard deviation for the complete six-hub population.
Here is the STDEV.P formula:
=STDEV.P(B2:B7)
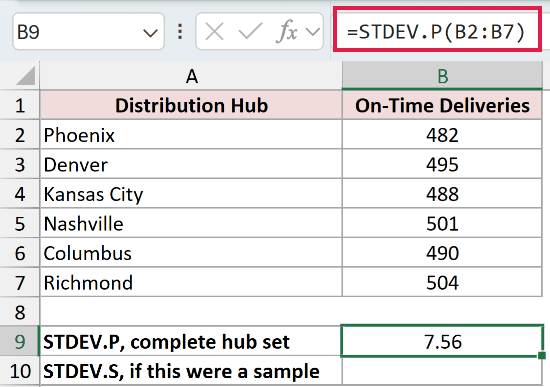
STDEV.P returns 7.56 because the six values are the entire group being described.
For comparison, suppose those hubs were only a sample selected from a larger network.
Here is the STDEV.S formula:
=STDEV.S(B2:B7)
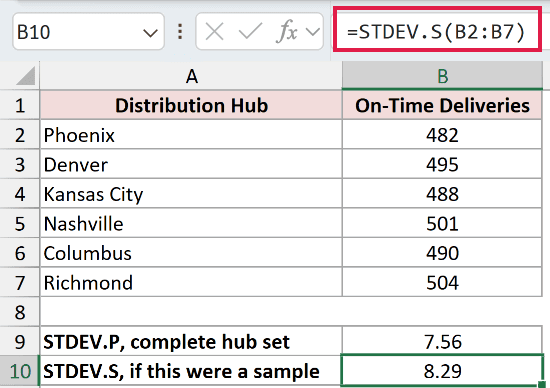
STDEV.S returns 8.29. It divides by n-1 to estimate variation in a larger population, while STDEV.P divides by n.
Pro Tip: Do not choose STDEV.P because its result is smaller. Choose it only when the data covers the complete population you want to describe.
Example 3: Compare Process Consistency
Population standard deviations make complete groups easier to compare.
Below is the dataset with every daily cycle-time record for two production lines and two empty result cells.
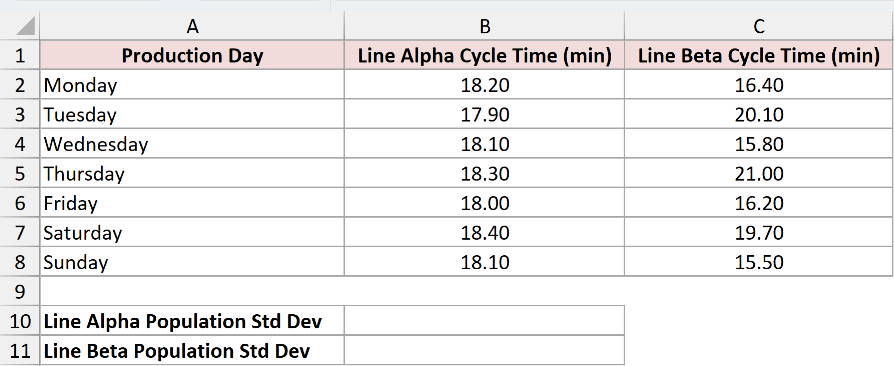
We want to measure Line Alpha’s variation across the full week.
Here is the formula:
=STDEV.P(B2:B8)
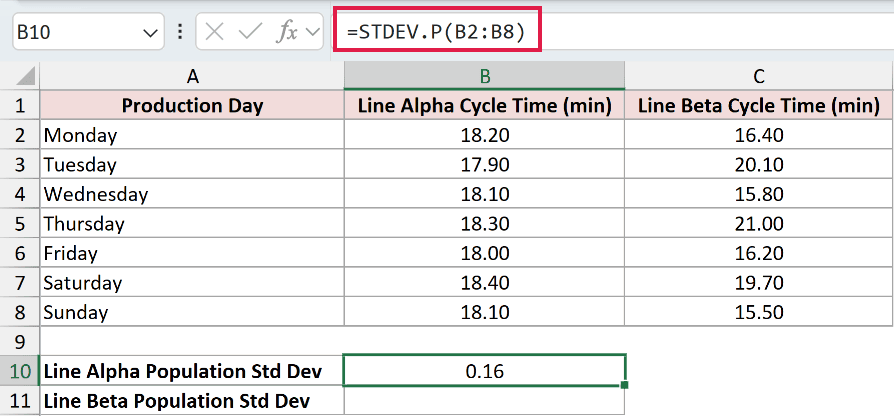
Line Alpha has a population standard deviation of 0.16 minutes.
We also want the same measure for Line Beta.
Here is the second formula:
=STDEV.P(C2:C8)
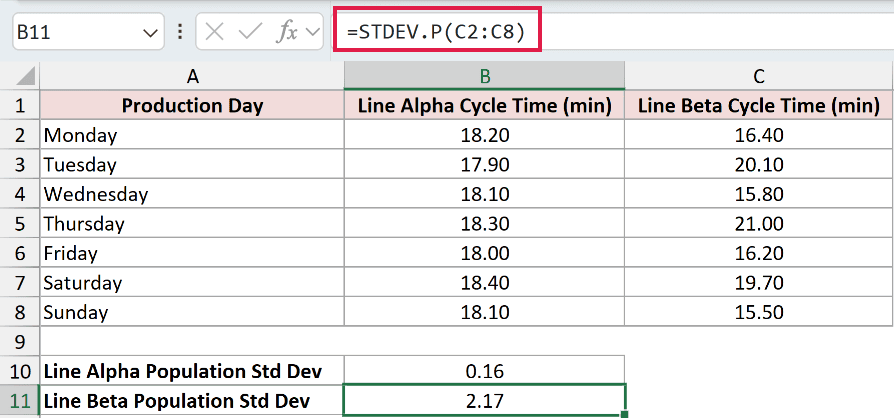
Line Beta’s population standard deviation is 2.17 minutes. Alpha is more consistent because its cycle times have much less spread.
Pro Tip: Compare standard deviations only when the measurements use the same units and represent populations defined in a comparable way.
Example 4: Calculate Standard Deviation by Group
STDEV.P can reduce a filtered array to one population statistic.
Below is the dataset with response times by region, an East criterion in E2, and an empty result cell in E3.
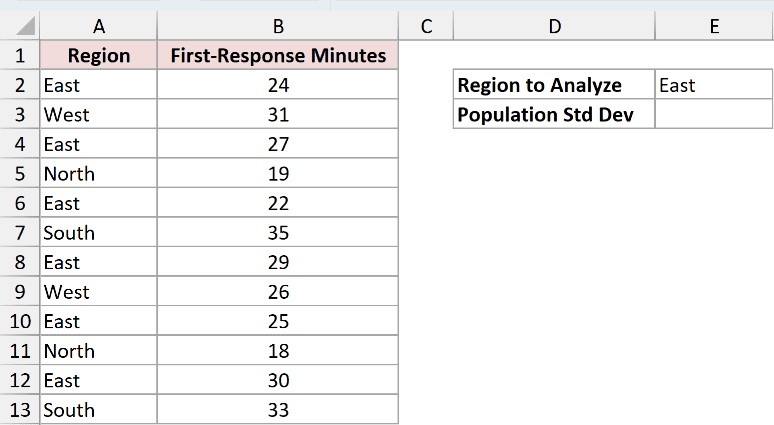
We want the population standard deviation for all six East-region response times.
Here is the formula:
=STDEV.P(FILTER(B2:B13,A2:A13=E2))
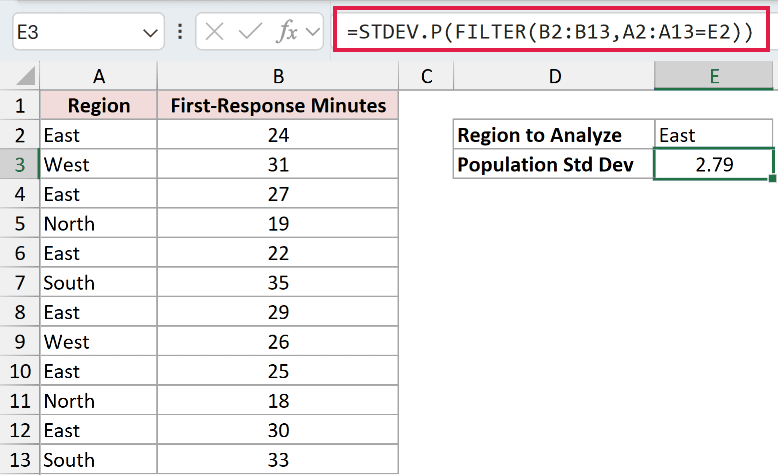
FILTER returns 24, 27, 22, 29, 25, and 30. STDEV.P reduces that array to one result: 2.79 minutes.
FILTER is available in Excel 2021, Excel 2024, Microsoft 365, and Excel for the web. Older versions need a helper range for the selected group.
Example 5: Combine Multiple Population Ranges
STDEV.P can accept several ranges without stacking them into a helper column.
Below is the dataset with every morning and evening shift check from Monday through Saturday and an empty combined result cell.
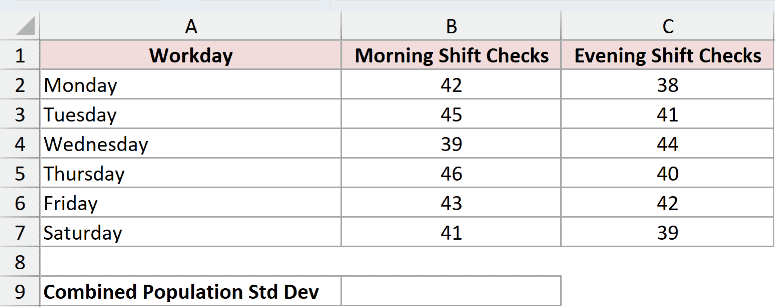
We want one population standard deviation across all 12 shift checks.
Here is the formula:
=STDEV.P(B2:B7,C2:C7)
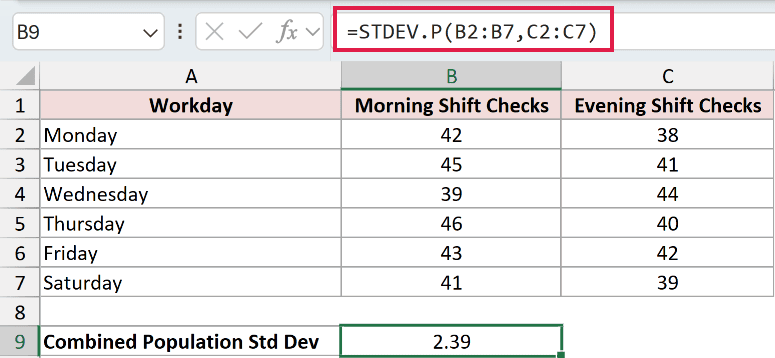
The two ranges become one 12-value population. STDEV.P returns a combined standard deviation of 2.39 checks.
Pro Tip: Separate ranges are fine when they belong to one population. Do not combine unrelated groups merely to avoid writing two formulas.
Tips & Common Mistakes
- Use STDEV.P for a complete population. Use STDEV.S when a sample is meant to estimate a larger population.
- Avoid the older
STDEVPname in new work. STDEV.P is its current replacement. - Remember that STDEV.P is a reducer. It accepts arrays but returns one number rather than a spilled list.
- Referenced empty cells, text, and logical values are ignored. Use STDEVPA when referenced text and logical values must count.
- Use
SQRT(VAR.P(range))as an audit relationship when working with population variance, not as a longer replacement for STDEV.P. - Check that every compared dataset uses the same measurement unit and population definition.
I covered complete-population spread, sample comparison, process consistency, filtered groups, and multiple-range calculations.
I hope you found this article helpful.
Related Excel Functions / Articles:
