
Excel’s VDB function returns an asset’s depreciation between two period boundaries using the variable declining balance method.
It starts with declining balance depreciation and, by default, switches to straight line when that produces a larger deduction.
In this article, I’ll show you how to calculate one period, build annual and quarterly schedules, compare factors, and handle partial years.
VDB Function Syntax in Excel
The VDB function accepts an asset’s values, the period boundaries, and two optional controls.
=VDB(cost, salvage, life, start_period, end_period, [factor], [no_switch])
- cost (required) is the asset’s initial cost.
- salvage (required) is the value expected at the end of the asset’s useful life. It can be 0.
- life (required) is the number of periods over which the asset is depreciated.
- start_period (required) is the beginning boundary of the period you want to calculate.
- end_period (required) is the ending boundary of the period you want to calculate.
- factor (optional) controls the declining balance rate. If omitted, Excel uses 2 for double declining balance.
- no_switch (optional) controls the switch to straight line. FALSE or omission allows the switch, while TRUE prevents it.
Start and end periods must use the same units as life. If life is in months, the period boundaries must also be in months.
When to Use VDB Function
- Calculate depreciation for one year, month, quarter, or fractional period.
- Build a depreciation schedule that can switch from declining balance to straight line.
- Compare depreciation schedules that use different declining balance factors.
- Keep declining balance depreciation active by setting the no_switch argument to TRUE.
- Calculate accumulated depreciation or an asset’s remaining book value.
Example 1: Calculate One Year’s Depreciation
Let’s start with one year’s depreciation for a wheel alignment system.
Below is the dataset. It shows the asset cost, salvage value, useful life, period boundaries, and an empty cell for Year 3 depreciation.
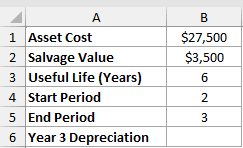
We want the depreciation from the start of Year 3 to its end.
Here is the formula:
=VDB(B1,B2,B3,B4,B5)
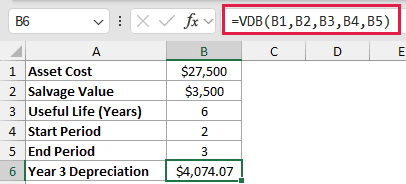
The formula returns $4,074.07 for the period from 2 to 3.
VDB uses boundaries rather than a single period number. Year 3 begins at 2 and ends at 3, while Year 1 runs from 0 to 1.
Example 2: Build a VDB Depreciation Schedule
Now let’s build a complete annual schedule for a hotel shuttle van.
Below is the dataset. It lists Years 1 through 6, empty Depreciation and Year-End Book Value columns, and an input table containing cost, salvage value, and useful life.
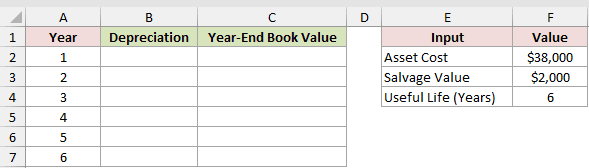
First, we want one depreciation amount for each year.
Here is the formula entered in B2:
=VDB(F2,F3,F4,A2:A7-1,A2:A7)
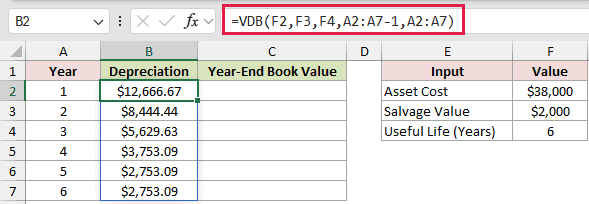
Next, we want the van’s year-end book value after accumulated depreciation.
Here is the formula entered in C2:
=F2-VDB(F2,F3,F4,0,A2:A7)
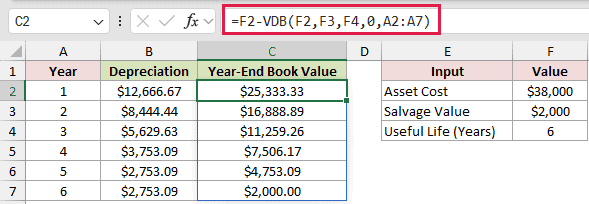
The first formula returns $12,666.67 for Year 1. It spills six annual depreciation amounts down column B.
Years 5 and 6 each return $2,753.09. VDB has switched to straight line because, from Year 5, straight line produces more depreciation than declining balance.
The second formula subtracts accumulated depreciation through each year from the $38,000 cost. The final book value is the $2,000 salvage value.
These range formulas spill in Excel 2021, Excel 2024, Microsoft 365, and Excel for the web.
In Excel 2019 and earlier, enter =VDB($F$2,$F$3,$F$4,A2-1,A2) in B2 and fill it down.
Enter =$F$2-VDB($F$2,$F$3,$F$4,0,A2) in C2 and fill it down.
Each formula uses the single Year cell in its row, while the dollar signs lock the input cells.
Pro Tip: Keep the cells below B2 and C2 empty. Any content blocking either output range causes a #SPILL! error.
Example 3: Compare VDB Depreciation Factors
Here’s a side-by-side factor comparison for a commercial embroidery machine.
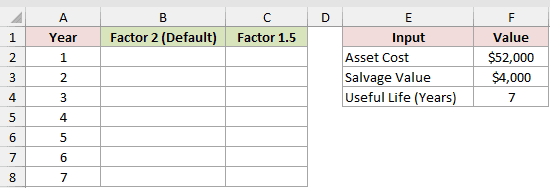
Below is the dataset. It lists seven years, empty result columns for factors 2 and 1.5, and the asset inputs.
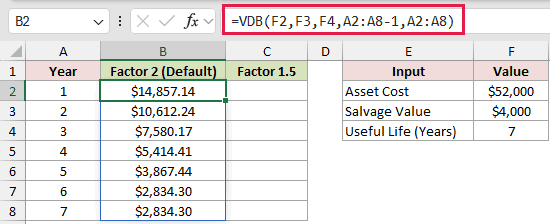
We want the annual schedule using VDB’s default factor of 2.
Here is the formula entered in B2:
=VDB(F2,F3,F4,A2:A8-1,A2:A8)
Next, we want the same schedule with a factor of 1.5.
Here is the formula entered in C2:
=VDB(F2,F3,F4,A2:A8-1,A2:A8,1.5)
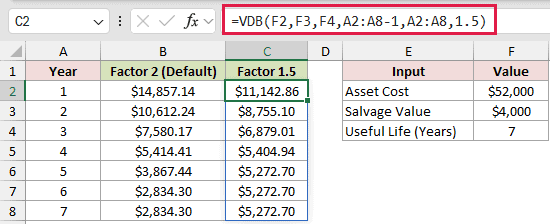
The default factor returns $14,857.14 in Year 1. Factor 1.5 starts lower at $11,142.86, so depreciation is spread more evenly.
Both schedules depreciate $48,000 in total. The factor 1.5 schedule switches to straight line in Year 5, while the default schedule switches in Year 6.
Example 4: Compare the no_switch Argument
Let’s see what happens when VDB can’t switch to straight line.
Below is the dataset. It lists five years, empty columns for the default and TRUE schedules, the asset inputs, and empty total cells.
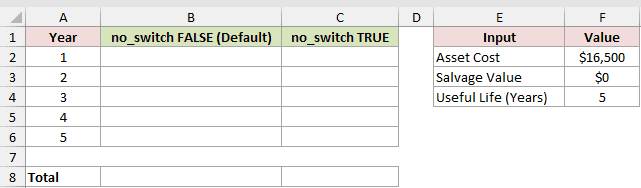
First, we want the default schedule, which allows the straight line switch.
Here is the formula entered in B2:
=VDB(F2,F3,F4,A2:A6-1,A2:A6)
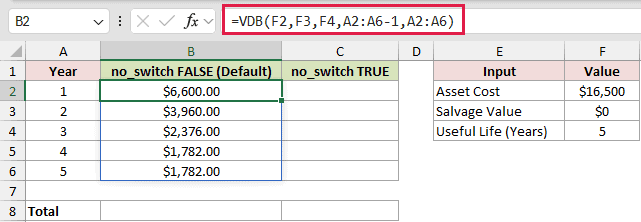
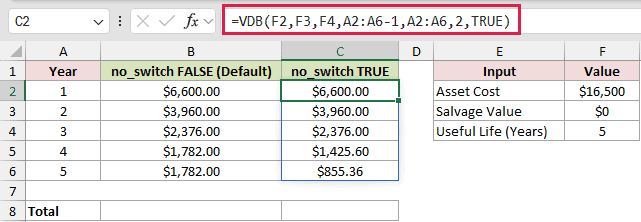
Next, we want declining balance depreciation for the full schedule without switching.
Here is the formula entered in C2:
=VDB(F2,F3,F4,A2:A6-1,A2:A6,2,TRUE)
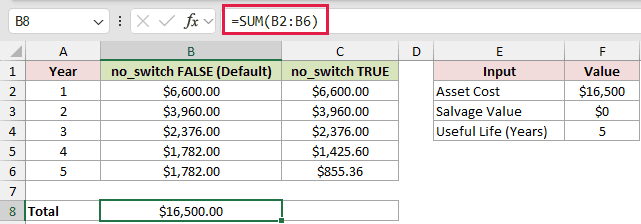
Now we can total the default schedule in B8.
=SUM(B2:B6)
Finally, we can total the no_switch schedule in C8.
=SUM(C2:C6)
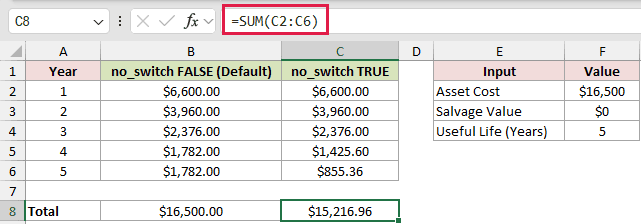
The default schedule returns $1,782.00 in both Years 4 and 5 after switching to straight line. Its total reaches the full $16,500 cost.
With no_switch set to TRUE, Years 4 and 5 fall to $1,425.60 and $855.36. The schedule totals $15,216.96, leaving $1,283.04 undepreciated.
The factor argument remains in the second formula because no_switch is the seventh argument. You can’t skip factor and move TRUE into its position.
Pro Tip: The no_switch setting matters only when straight line depreciation would exceed the declining balance amount. Some asset values produce identical TRUE and FALSE schedules.
Example 5: Calculate Partial-Year Depreciation
Here’s a fiscal-year schedule for a refrigerated truck placed in service on April 1.
Below is the dataset. It lists fiscal years, fractional start and end periods, an empty depreciation column, and the asset inputs.
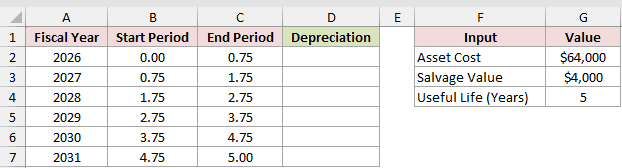
We want each fiscal year’s change in accumulated depreciation.
Here is the formula entered in D2:
=VDB(G2,G3,G4,0,C2:C7)-VDB(G2,G3,G4,0,B2:B7)
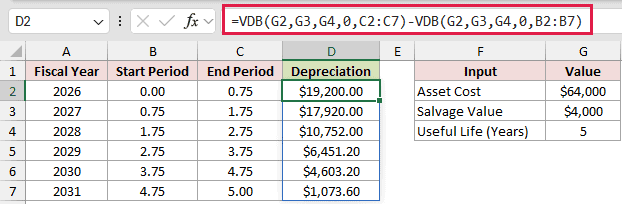
Fiscal 2026 follows the calendar year and ends December 31. From April 1 through year-end, the truck is in service for nine months, or 0.75 of a year.
The first fiscal-year result is $19,200.00.
Each row subtracts accumulated depreciation at its start boundary from accumulated depreciation at its end boundary. The six rows total $60,000, which equals cost minus salvage.
Pro Tip: The direct form =VDB(G2,G3,G4,B2:B7,C2:C7) returns 4,541.44 and 1,135.36 for the last two fiscal years instead of 4,603.20 and 1,073.60. Both schedules total $60,000, but the cumulative version keeps each row aligned with the change in accumulated depreciation.
Example 6: Calculate Quarterly VDB Depreciation
The last example calculates quarterly depreciation from a life measured in months.
Below is the dataset. It lists eight quarters, their start and end months, an empty depreciation column, and the asset inputs.
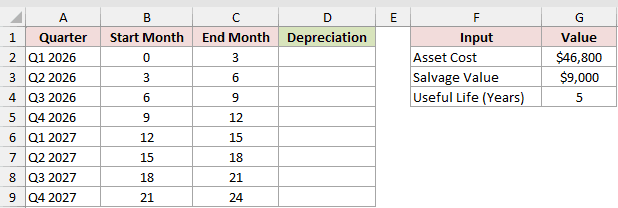
We want the depreciation for each three-month span.
Here is the formula entered in D2:
=VDB(G2,G3,G4*12,B2:B9,C2:C9)
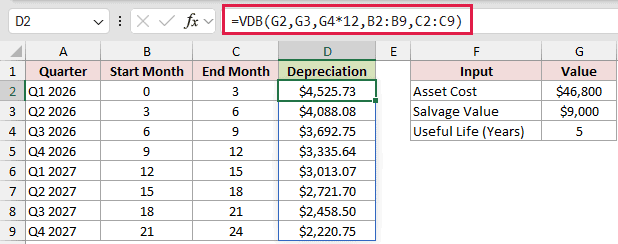
Multiplying useful life by 12 converts five years into 60 months, matching the units used by the start and end columns.
The first quarter returns $4,525.73. The first four quarters total $15,642.20.
A monthly life applies a monthly declining rate. Those four quarters don’t match the $18,720.00 first-year result produced when life and boundaries are measured in years.
Tips & Common Mistakes
- Treat start_period and end_period as boundaries. To calculate Year N, use N minus 1 as the start and N as the end.
- Keep life, start_period, and end_period in the same units. Mismatched units return #NUM! when a boundary exceeds life, or a wrong amount otherwise.
- If start_period equals end_period, VDB returns 0. A formula using 3 and 3 doesn’t calculate Year 3.
- Excel returns #NUM! when start_period is greater than end_period or when end_period is greater than life.
- Factor defaults to 2, and no_switch defaults to FALSE. Use TRUE only when you want to prevent the straight line switch.
- VDB can spill over ranges of costs, salvage values, useful lives, and period boundaries.
- Salvage greater than cost can return a negative depreciation amount rather than an error. Check asset inputs before relying on the result.
- DDB matches VDB’s first-period result with factor 2, but DDB doesn’t make VDB’s automatic straight line switch.
VDB works best when your schedule needs declining balance depreciation with flexible period boundaries.
Its optional arguments let you adjust the rate or keep declining balance active for the asset’s entire life.
Related Excel Functions / Articles:
