If you want to spread the cost of an asset evenly across its useful life, the SLN function in Excel is the quickest way to do it.
In this article, I’ll show you how to use SLN to calculate straight-line depreciation, spill it across a fleet of assets in one formula, and avoid the small gotchas that trip people up.
In Excel 365, you can also feed SLN ranges for cost, salvage, and life, and the results spill into the cells below. That means one formula handles every asset in your register, no fill-down required.
SLN Function Syntax in Excel
Here is the syntax of the SLN function:
=SLN(cost, salvage, life)
- cost – The initial cost of the asset (what you paid for it). Can be a single value or a range when you want the result to spill.
- salvage – The value of the asset at the end of its useful life (also called salvage or scrap value). Single value or range.
- life – The number of periods (usually years) over which the asset is depreciated. Single value or range.
The formula SLN uses behind the scenes is simple:
= (cost - salvage) / life
That’s why it’s called “straight-line”. The depreciation amount is exactly the same in every period.
A Quick Refresher on Depreciation
Depreciation is just an accountant’s way of spreading the cost of an asset over the years you actually use it, instead of expensing it all in year one.
Say you buy an espresso machine for $10,000 and expect to use it for 5 years before selling it for $1,000. The cost you “use up” each year is part of that $9,000 drop in value.
Straight-line depreciation says you used up the same amount each year. Other methods (like DDB or SYD) front-load the depreciation so more of it lands in the early years.
When to Use the SLN Function
Use this function when you need to:
- Calculate annual depreciation for an asset that loses value evenly over time.
- Build a depreciation schedule for accounting or tax records.
- Spill annual depreciation across a fleet of assets in one formula.
- Compare straight-line numbers against accelerated methods like DDB or SYD.
- Estimate the book value of an asset for any year of its life.
Let me show you a few practical examples of how to use the SLN function.
Example 1: Depreciation of a Single Asset
Let’s start with a simple example.
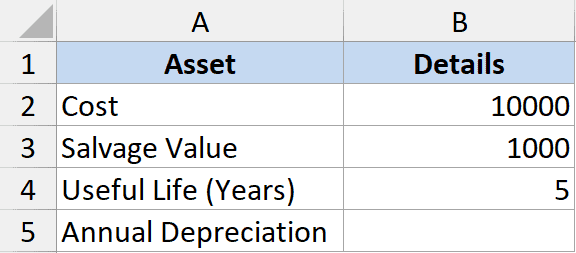
Below is the dataset with the cost, salvage value, and useful life of a commercial espresso machine.
I want the annual depreciation for this espresso machine.
Here is the formula:
=SLN(B2, B3, B4)
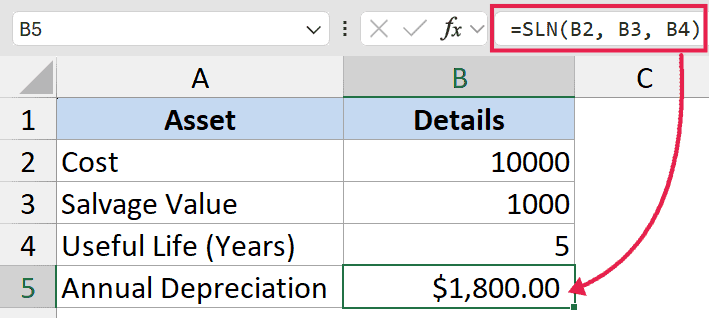
In the above formula, SLN takes the cost ($10,000), subtracts the salvage value ($1,000), and divides by the useful life (5 years).
That gives you $1,800 of depreciation per year, every year, for 5 years.
The number SLN returns is the depreciation for a single period. Since straight-line is constant, this same number applies to every year of the asset’s life.
Example 2: Spill Depreciation Across a Fleet of Assets
Here’s the example a 2026 reader most needs.
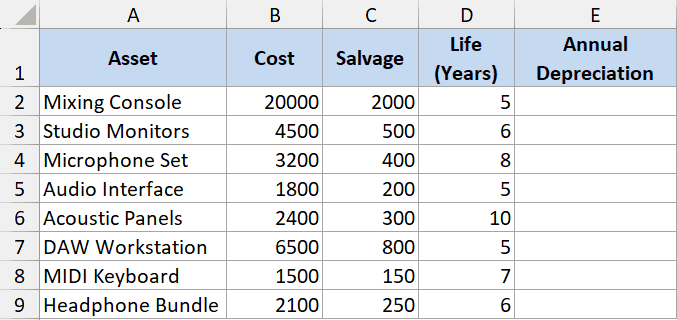
Below is a fixed-asset register for a small recording studio: 8 pieces of equipment with their cost, salvage value, and useful life. We want the annual depreciation for each, all in one shot.
Here is the formula:
=SLN(B2:B9, C2:C9, D2:D9)
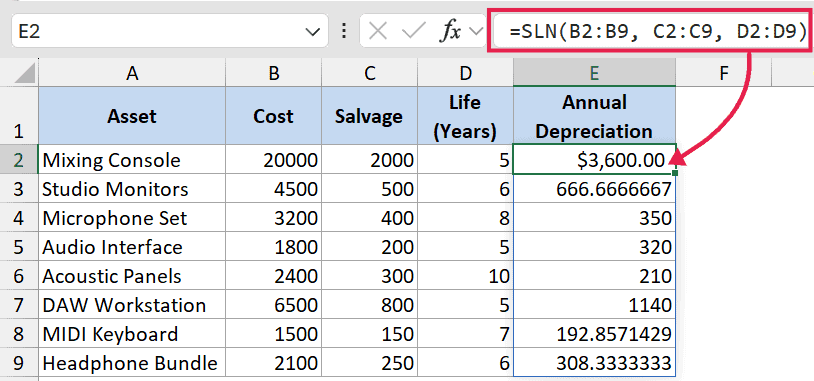
In the above formula, SLN reads three parallel columns and pairs them row by row. Cell E2 gets the depreciation for the first asset, E3 for the second, and so on, all spilling out from a single formula in E2.
When you add a 9th piece of equipment, just extend the ranges (or use full-table references), and the spill grows with the data. No drag-down, no copy-paste of formulas down the column.
Example 3: Building a Full Depreciation Schedule
Now let’s look at something more practical.
A depreciation schedule shows the asset’s depreciation expense, accumulated depreciation, and book value for each year.
Below is a setup for a $20,000 sound mixing console with a $2,000 salvage value and a 5-year life. The cost, salvage, and life sit in B1:B3 on the left. The schedule grid sits to the right in columns D to G, with headers in row 1 (Year, Depreciation, Accumulated Depreciation, Book Value) and the year numbers 1 to 5 in D2:D6.
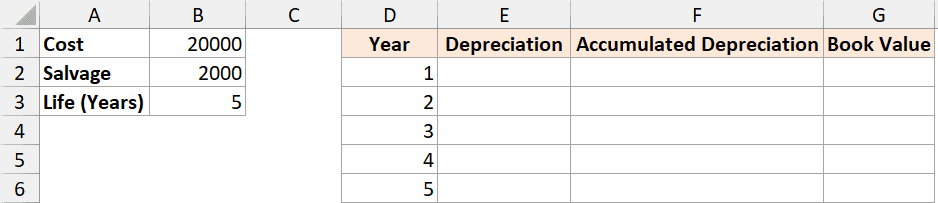
I want a 5-year schedule that shows the annual depreciation, the running accumulated total, and the remaining book value for each year.
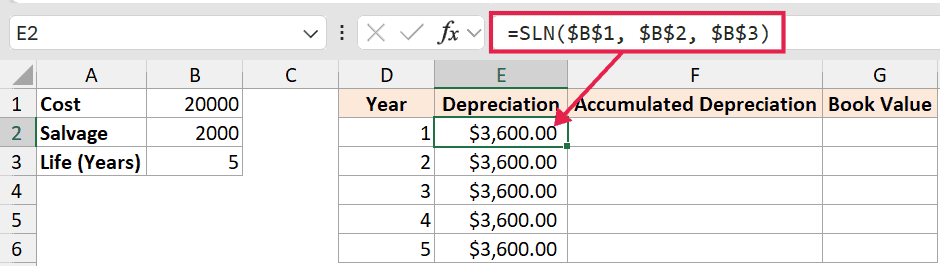
For the depreciation column, drop this into E2 and copy it down to E6:
=SLN($B$1, $B$2, $B$3)
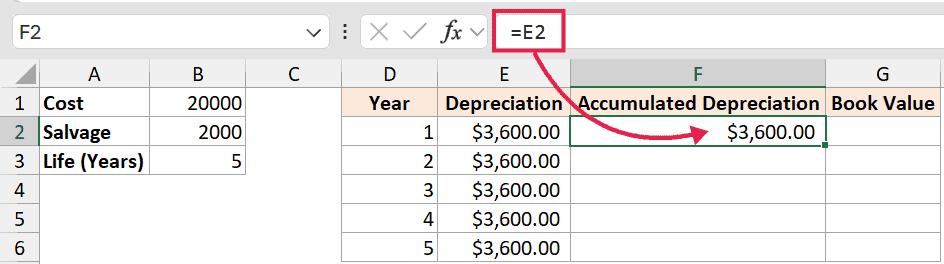
The first row of the accumulated column is just the year-1 depreciation. In F2:
=E2
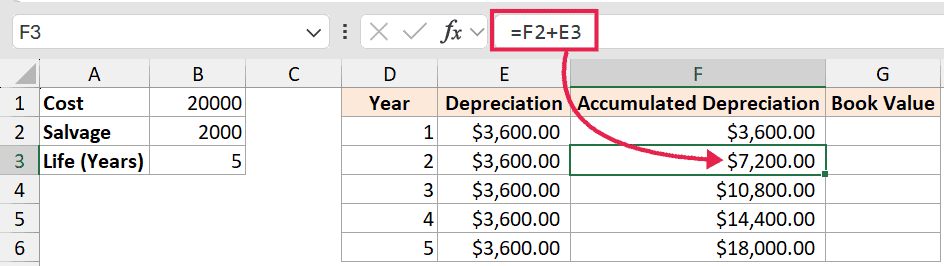
From year 2 onwards, each row adds the previous accumulated total to this year’s depreciation. Put this in F3 and copy it down to F6:
=F2 + E3
For the book value column, drop this into G2 and copy it down to G6:
=$B$1 - F2
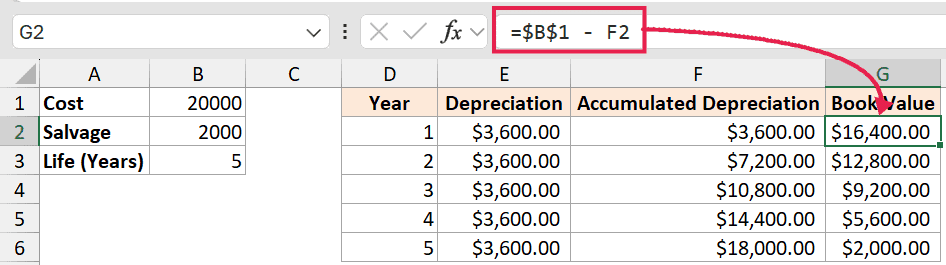
What happens is the depreciation column shows the same $3,600 every year. The accumulated column grows by $3,600 each row until it reaches $18,000 (the total depreciable amount).
The book value column drops by $3,600 a year and lands exactly at the salvage value of $2,000 in year 5.
If you’d rather skip the manual setup, you can also use our depreciation schedule calculator to generate the same table from a few inputs.
Example 4: Comparing SLN with Other Depreciation Methods
Excel has a few depreciation functions:
- SLN gives you the same amount each year.
- DDB (double-declining balance), SYD (sum-of-years’ digits), and DB (fixed declining balance) all front-load depreciation, so the early years take a bigger hit.
Let’s build a 5-year side-by-side comparison for a $10,000 piece of studio equipment with a $1,000 salvage value. The setup has a Year column in A2:A6 with the years 1 to 5, and one column per method (B for SLN, C for DDB, D for SYD, E for DB) with headers in row 1.
I want all 5 years of depreciation for each method, side by side in one row per year.
SLN returns the same number every year, so drop this into B2 and copy it down to B6:
=SLN(10000, 1000, 5)
For DDB, SYD, and DB, the trick is passing SEQUENCE(5) as the period argument. Each formula then returns one result per year and spills 5 rows in a single shot.
In C2 (spills to C6):
=DDB(10000, 1000, 5, SEQUENCE(5))
In D2 (spills to D6):
=SYD(10000, 1000, 5, SEQUENCE(5))
In E2 (spills to E6):
=DB(10000, 1000, 5, SEQUENCE(5))
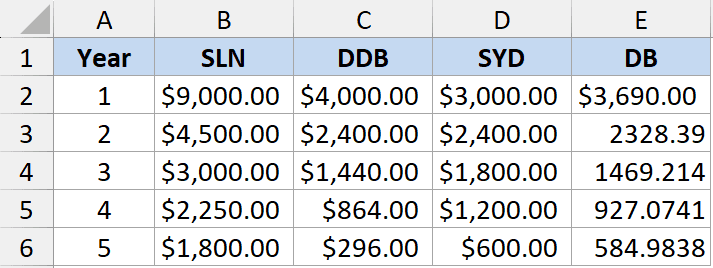
Here’s what falls out:
- SLN: $1,800 every year (flat).
- DDB: $4,000 → $2,400 → $1,440 → $864 → $296. Most of the depreciation hits in year 1.
- SYD: $3,000 → $2,400 → $1,800 → $1,200 → $600. A smoother taper than DDB.
- DB: $3,690 → $2,328 → $1,469 → $927 → $585. Similar shape to DDB but using a fixed rate.
All four columns total to $9,000 (cost minus salvage). They just distribute that $9,000 very differently across the 5 years.
Quick rule of thumb on which to pick:
- SLN is the right choice when the asset loses value evenly (office furniture, buildings).
- DDB or DB suit assets that lose most of their value early (laptops, phones, vehicles in heavy use).
- SYD is a middle ground between SLN and DDB.
- VDB is the flexible one. It can switch from declining-balance to straight-line partway through the life.
Pick the method that matches how the asset actually loses value, not just the one that gives you the biggest deduction in year one.
Tips & Common Mistakes
- #SPILL! when destination cells aren’t free. If something is in the way of where the spill needs to land, you’ll get
#SPILL!. Clear the spill range or move the formula. - Watch the
@implicit intersection. Older Excel versions can auto-insert@(e.g.=@SLN(...)) when they save a workbook, which collapses the spill to a single cell. Remove the@to restore it. - Negative result when salvage is greater than cost. If your salvage value is higher than the cost (which shouldn’t really happen in practice), SLN returns a negative number. Double-check the inputs if you see one.
- Asset Life value doesn’t have to be a whole number. You can use 7.5 years if you really need to. SLN will still divide evenly across that period.
- Match the period. If your asset life value is in years, the result is depreciation per year. If it’s in months, the result is per month. Pick a consistent unit and stick with it.
- Same answer every period. Unlike DDB or SYD, SLN doesn’t take a
periodargument. There’s no point passing one. The depreciation is identical every year by definition. - Total depreciation = cost – salvage. A quick sanity check: multiply your SLN result by
lifeand you should get exactlycost - salvage. If not, something’s off in the inputs.
That’s pretty much everything you need to know about the SLN function in Excel. It’s one of the simpler financial functions, but feeding it whole columns of cost, salvage, and life turns it into a real workhorse for fixed-asset registers.
Once you’re comfortable with SLN, the other depreciation functions (DDB, DB, SYD) make a lot more sense, and the same range-input pattern works on most of them too.
Other Excel articles you may also like: