If you want to raise the mathematical constant e to a certain power in Excel, the EXP function is what you’re looking for.
It takes a single number and gives you e raised to that power, which shows up all the time in growth, decay, and interest calculations.
In Excel 365, you can also feed EXP a whole range and the results spill into the cells below. In this article, I’ll walk you through how to use the EXP function with a few practical examples.
EXP Function Syntax in Excel
The EXP function has a simple, one-argument syntax.
=EXP(number)
- number – the exponent you want to raise e to. This is the only argument, and it’s required.
The constant e is roughly 2.71828, so =EXP(1) returns about 2.71828 and =EXP(2) returns about 7.38906.
When to Use EXP Function
The EXP function comes in handy whenever you’re working with the constant e. A few common cases:
- Calculating continuous compound interest, where money grows by e raised to the rate times time.
- Modeling exponential decay, like a drug clearing the body or a value depreciating.
- Reversing a natural log, since EXP and LN undo each other.
- Building statistical and machine-learning formulas, such as the sigmoid (logistic) curve.
Example 1: Calculate e Raised to a Power
Let’s start with the basics and see what EXP actually returns.
Below is a dataset with a single column of exponents in column A. The values include whole numbers, negatives, and a decimal so you can see how EXP handles each one.
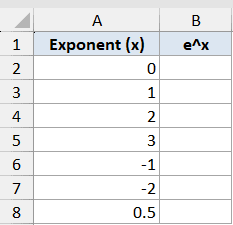
I want to get e raised to each of these exponents in column B.
Here is the formula:
=EXP(A2:A8)
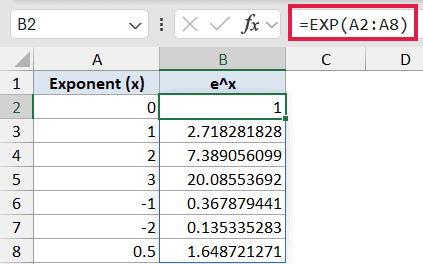
Because this is Excel 365, the single formula in B2 spills down the whole column, giving you one result for each exponent.
Notice the result for an exponent of 1 is about 2.71828, which is the constant e itself. An exponent of 0 returns 1, and the negative exponents return values between 0 and 1.
Pro Tip: EXP only works with numbers. If you point it at text or a blank that Excel reads as text, it returns a #VALUE! error.
Example 2: Continuous Compound Interest
Here’s a classic real-world use for EXP: continuous compound interest.
Below is a dataset with six accounts. Column B has the starting principal, column C the annual rate as a decimal (so 0.05 means 5%), and column D the number of years.
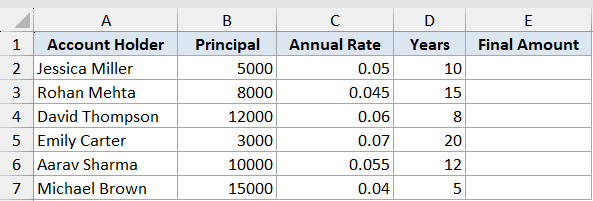
I want to find the final amount for each account using the continuous-growth formula, which is principal times e raised to the rate times the years.
Here is the formula:
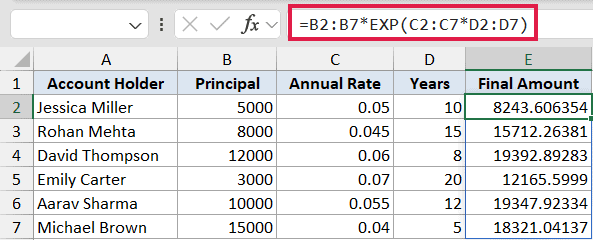
=B2:B7*EXP(C2:C7*D2:D7)
How this formula works:
C2:C7*D2:D7multiplies each rate by its years to get the exponent for that row.EXP(...)raises e to that exponent, giving the growth factor.- Multiplying by the principal in
B2:B7returns the final balance.
Since each part of the formula works on a range, the result spills down all six rows from a single formula in E2.
Example 3: Model Exponential Decay
EXP is just as useful for things that shrink over time. The trick is a negative exponent.
Below is a dataset tracking how many hours have passed since a patient took a 500 mg dose of medication. Column A has the elapsed hours.
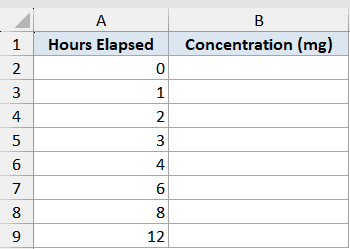
I want to calculate how much of the drug is left in the body at each point, assuming it decays at a rate of 0.12 per hour.
Here is the formula:
=500*EXP(-0.12*A2:A9)
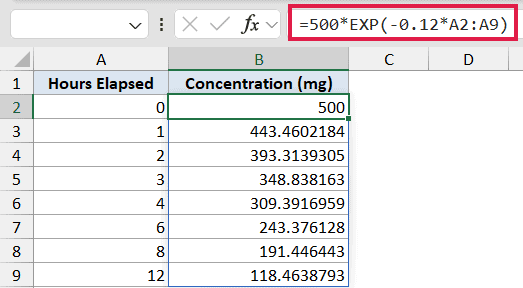
The minus sign in front of the rate is what makes this a decay instead of growth. As the hours go up, the exponent gets more negative, so EXP returns a smaller and smaller factor.
The starting dose of 500 mg drops steadily, and you can read off roughly how much is left at any hour in the table.
Example 4: EXP and LN Are Inverse Functions
EXP has a close partner in the LN function, which returns the natural logarithm of a number. The two undo each other.
Below is a dataset with a single column of values in column A.
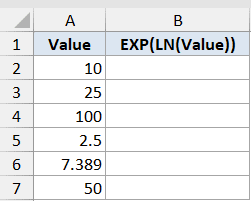
I want to take the natural log of each value and then raise e to that result, which should hand back the original number.
Here is the formula:
=EXP(LN(A2:A7))
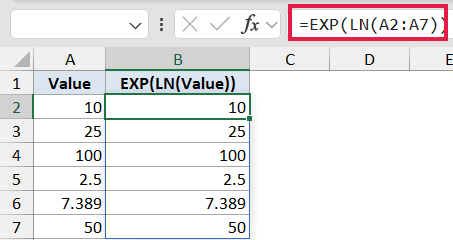
Look at column B and you’ll see it matches column A exactly. That’s the whole point: LN turns a number into its exponent, and EXP raises e back to that exponent, landing you right where you started.
Raising e to a log value like this is also how you calculate an antilog in Excel. If you ever have an LN on one side of an equation, wrapping both sides in EXP cancels it out.
Example 5: Build a Sigmoid (Logistic) Curve
For a final example, let’s use EXP inside a bigger formula. The sigmoid, or logistic, function squashes any number into a value between 0 and 1, which makes it popular in statistics and machine learning.
Below is a dataset with a column of input values, often called z, ranging from negative to positive.
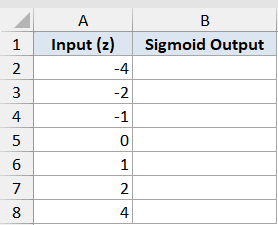
I want to run each input through the sigmoid formula, which is 1 divided by 1 plus e raised to the negative input.
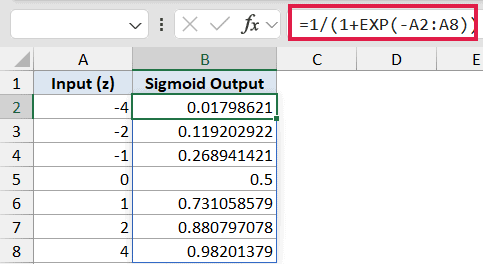
Here is the formula:
=1/(1+EXP(-A2:A8))
How this formula works:
-A2:A8flips the sign of each input.EXP(...)raises e to that value.1/(1+...)does the final math that pins every result between 0 and 1.
Large negative inputs land near 0, large positive inputs land near 1, and an input of 0 returns exactly 0.5. That smooth S-shape is the signature of the sigmoid curve.
Tips & Common Mistakes
- EXP only takes a number. Feed it text and you’ll get a #VALUE! error, so make sure your input cells hold numeric values.
- EXP always uses e as its base. To raise a different base to a power, use the POWER function or the
^operator instead (for example,=POWER(2, 3)or=2^3). - Don’t confuse EXP with the
^operator.=EXP(2)means e squared, while=2^2means 2 squared. They’re completely different results. - In Excel 365 you no longer need to drag EXP down a column. Point it at a range and the results spill automatically.
EXP is a small function that quietly powers a lot of bigger formulas. Once you know it just means “e raised to this power,” those longer formulas with an e buried inside them get a lot easier to read.
Across these examples you’ve seen EXP on its own, paired with LN, and nested inside a larger formula, which covers just about every way you’ll use it in practice.
Related Excel Functions / Articles: