
The VARA function in Excel calculates sample variance, including text and logical values stored in the selected cells. Variance measures how spread out the observations are.
VARA treats text as zero. That makes sense when a survey response says “No visits,” but it distorts the result when a note means the measurement is missing.
I’ll show you when counting text is appropriate, how to interpret variance in squared units, and how to handle TRUE/FALSE flags and Yes/No answers.
VARA Function Syntax in Excel
The VARA function accepts values or references to the cells you want to include:
=VARA(value1, [value2], ...)
- value1 (required): The first value or range containing your sample observations.
- value2, … (optional): Additional values or ranges to include in the same calculation.
In a referenced range, VARA counts TRUE as 1 and FALSE or text as 0. It ignores genuinely empty cells.
A formula returning empty text still counts as zero. A number stored as text in a cell also counts as zero, not as the number it resembles.
When to Use VARA Function
- Measure variation in sample survey responses where text such as “No visits” genuinely means zero.
- Calculate sample variance for activity counts that include labels such as “No demos.”
- Measure variation in TRUE/FALSE checklist results without replacing the logical values in the worksheet.
Example 1: Include Text That Means Zero
Let’s start with survey responses where the text has a clear numeric meaning.
Below is the dataset. Columns A and B list respondents and gym visits, while D2 labels the sample variance that will appear in E2.
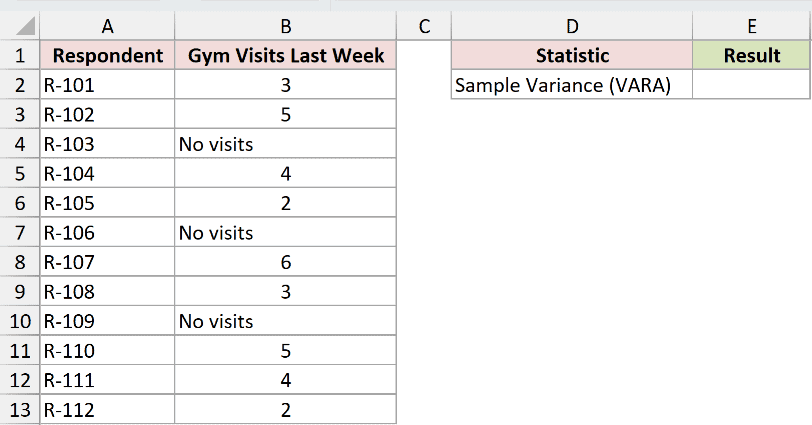
We want the sample variance of gym visits, including respondents who reported “No visits.”
Enter this formula in E2:
=VARA(B2:B13)
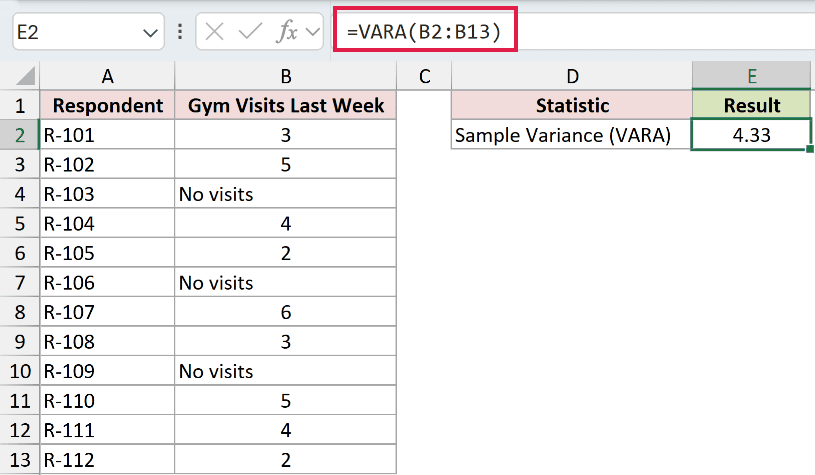
The result is 4.33, expressed in visits squared. VARA includes each “No visits” response as zero, so those respondents remain part of the calculation.
These responses represent a sample of gym users. The variance measures how spread out their visit counts are around the sample average.
Although the formula reads a range, it returns a single result in E2. It doesn’t spill a separate answer for each respondent.
Pro Tip: Keep missing responses distinct from “No visits.” VARA treats any text label as zero, so a note such as “No response” would incorrectly count as someone who never visited.
Example 2: Recognize When Text Distorts Variance
Now let’s look at a case where counting text as zero is the mistake.
Below is the dataset. Columns A and B contain package IDs and weights, including “Not weighed” notes. D2:D3 label the comparison results planned for E2:E3.
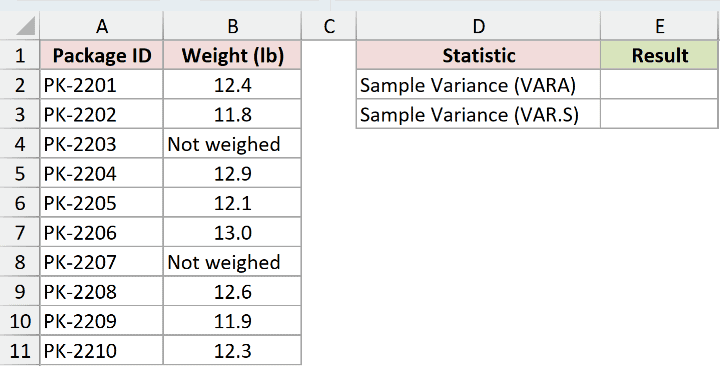
We want to measure variation in the recorded package weights without treating missing measurements as weightless packages.
First, enter this VARA formula in E2:
=VARA(B2:B11)
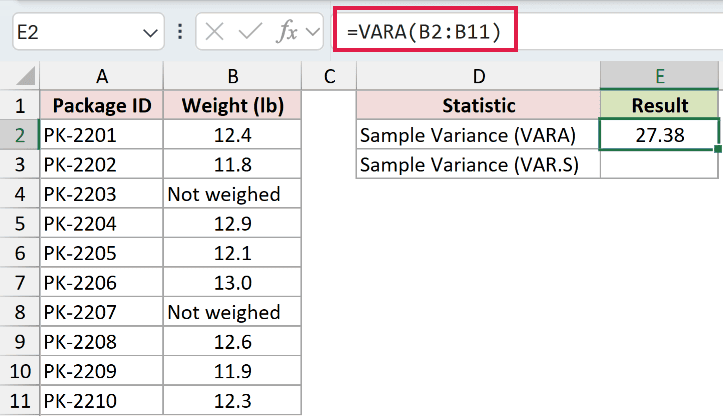
The result is 27.38. VARA counts “Not weighed” as zero, introducing weights that were never measured.
For comparison, VAR.S calculates sample variance from the numeric cells and ignores text notes. That matches our goal of analyzing the recorded weights.
Enter the appropriate comparison formula in E3:
=VAR.S(B2:B11)
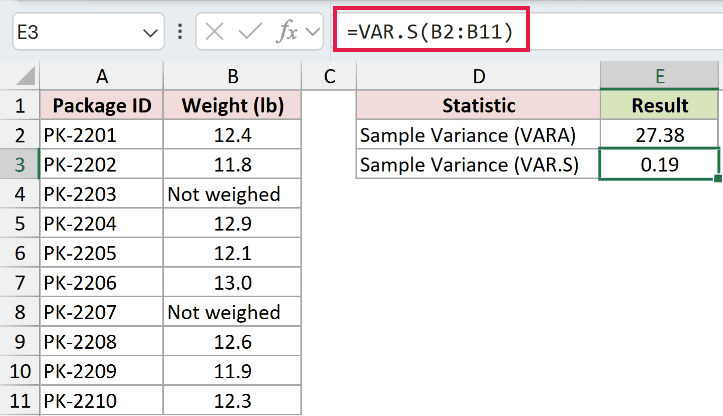
This comparison returns 0.19 pounds squared for the recorded weights. The extra zeros counted by VARA explain the much larger result in E2.
Skipping the notes doesn’t recover the missing measurements. It keeps them out of this calculation until you have actual weights to enter.
Example 3: Convert Variance to Original Units
Variance is useful, but its squared units can make the result harder to interpret.
Below is the dataset. Columns A and B contain sales reps and demo counts. D2:D4 label the variance and standard-deviation results planned for E2:E4.
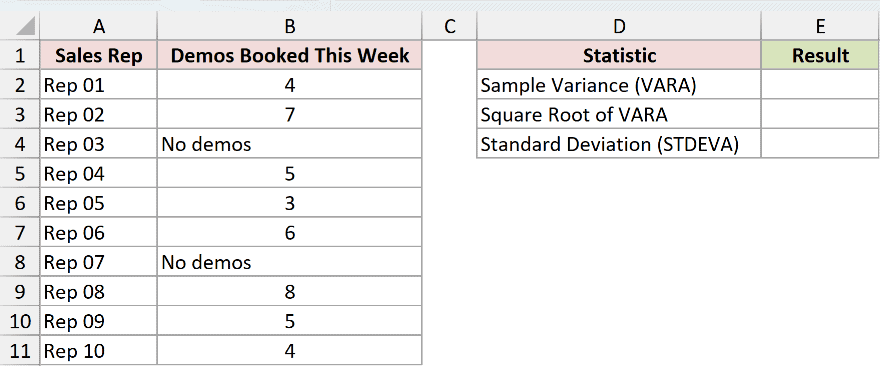
We want the sample variance of demo counts, then a measure of spread expressed in the original unit, demos.
Enter the VARA formula in E2:
=VARA(B2:B11)
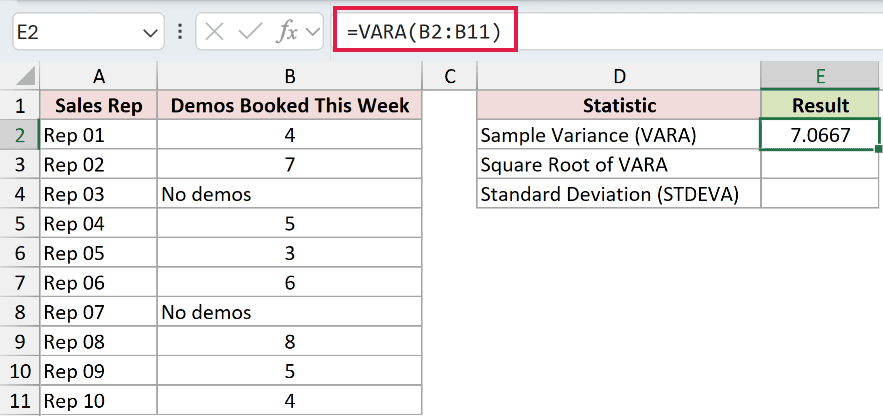
VARA returns 7.0667 demos squared. The “No demos” entries correctly count as zero because they describe reps who booked none.
SQRT calculates a square root. Applying it to VARA converts the variance into sample standard deviation, bringing the result back to demos.
Enter this formula in E3:
=SQRT(VARA(B2:B11))
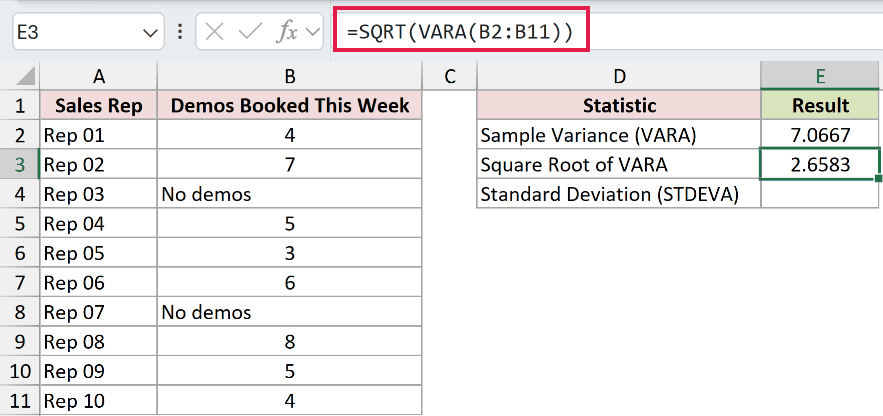
The result is 2.6583 demos. The formula uses the full calculated variance, so you don’t need to retype the rounded value displayed in E2.
To check the square-root result, STDEVA calculates sample standard deviation directly while counting text and logical values in a range using the same rules as VARA.
Enter the comparison formula in E4:
=STDEVA(B2:B11)
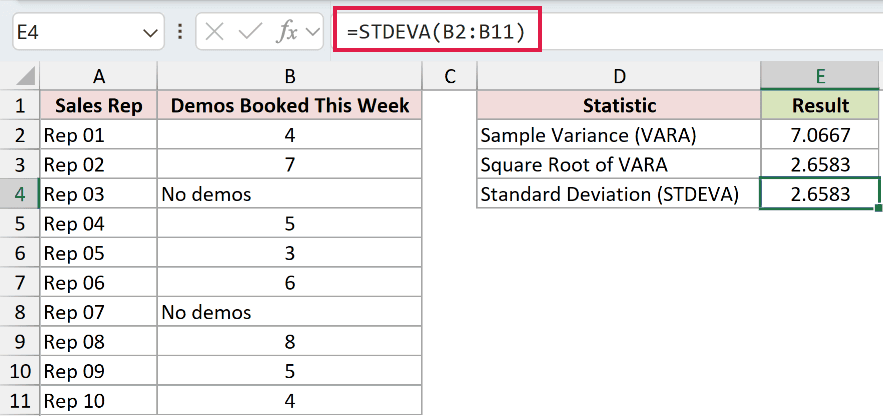
The comparison also returns 2.6583. Use VARA when you need variance; the square-root step explains how that result connects to standard deviation.
Example 4: Avoid Errors With Logical Flags
A filled TRUE/FALSE column can still produce a #DIV/0! error when the variance calculation ignores logical values.
Below is the dataset. Columns A and B list site audits and checklist flags. D2:D3 label the results planned for E2:E3.
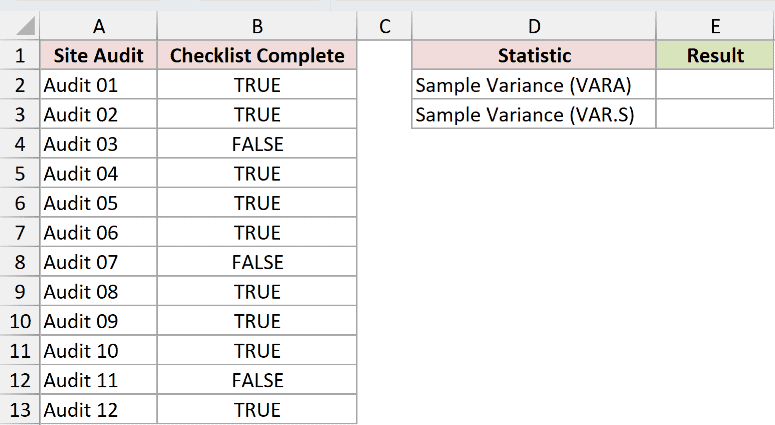
We want sample variance for checklist completion, counting each TRUE or FALSE flag as an observation.
Enter this formula in E2:
=VARA(B2:B13)
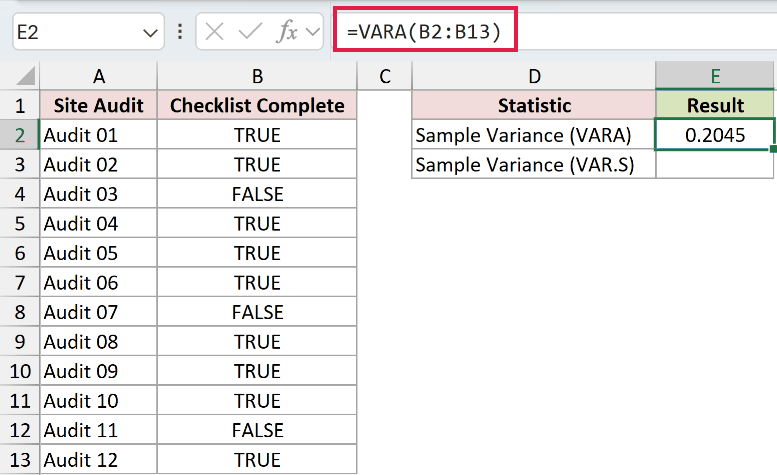
VARA returns 0.2045 because it treats TRUE as 1 and FALSE as 0. The checklist column stores each flag as a logical value.
Here, VAR.S calculates sample variance from numbers but ignores logical values in cell references. That makes it unsuitable for this unchanged flag column.
Enter the comparison formula in E3:
=VAR.S(B2:B13)
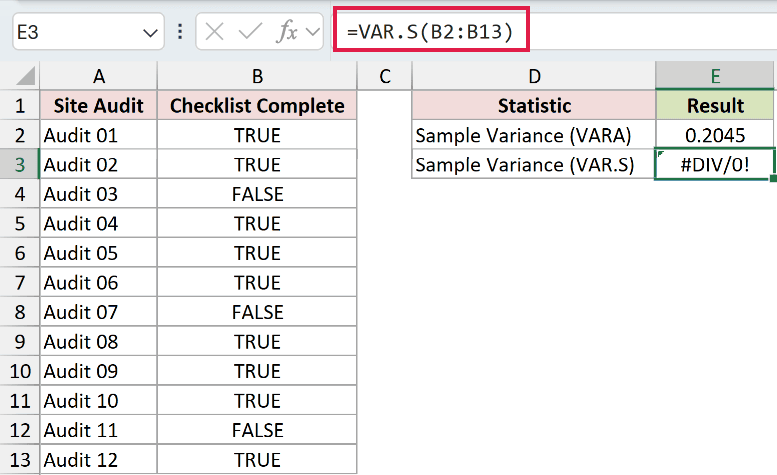
The comparison returns #DIV/0!. After ignoring the logical entries, it has no numeric observations left to calculate sample variance.
VARA includes every checklist flag, so it can calculate variance directly from this logical column.
Example 5: Correct the Yes/No Text Trap
The renewal answers “Yes” and “No” are text. To measure variation between them, we need to convert those answers into numbers.
Below is the dataset. Columns A and B list customers and renewal answers. D2:D3 label the raw-text and converted results planned for E2:E3.
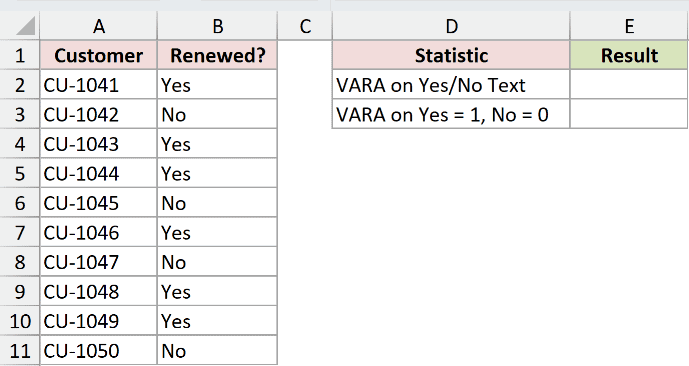
We want sample variance for renewal outcomes, treating Yes as 1 and No as 0.
First, enter this formula in E2 to apply VARA directly to the answers. This misses the difference between renewal outcomes:
=VARA(B2:B11)
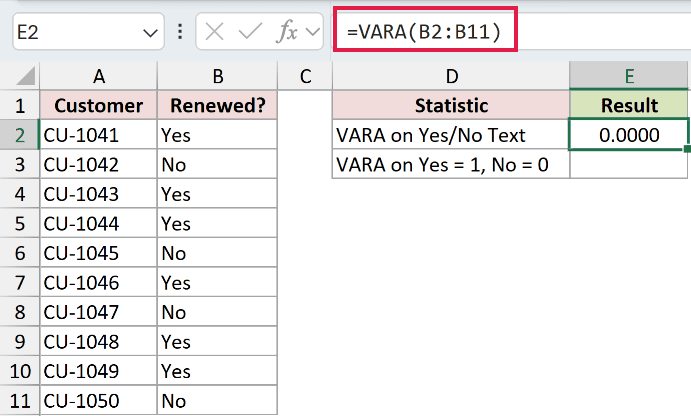
The result is 0.0000. VARA counts both “Yes” and “No” as zero, so it sees no difference between the answers.
Enter the corrected formula in E3:
=VARA(--(B2:B11="Yes"))
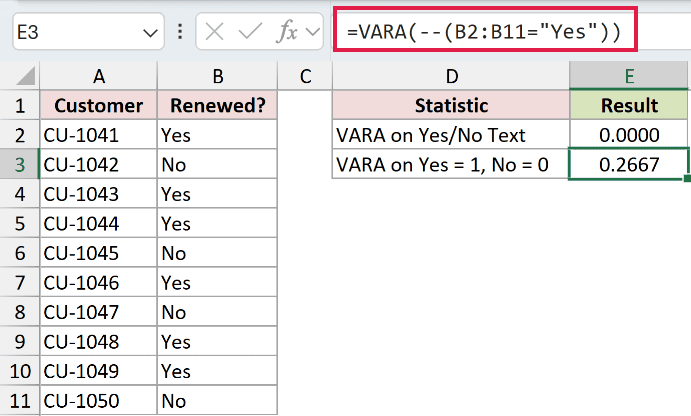
The corrected result is 0.2667, which reflects the variation between renewed and non-renewed customers in the sample.
How this formula works:
B2:B11="Yes"checks each answer and creates TRUE or FALSE values.--converts those logical values into numeric 1s and 0s.- VARA calculates sample variance from the converted numbers and returns a single result. Nothing spills into neighboring cells.
Pro Tip: Check that this column contains only Yes or No before using the conversion. Anything that doesn’t match “Yes” is treated as a non-renewal, including a missing answer or an unexpected label.
Tips & Common Mistakes
- Check what text means. VARA doesn’t interpret words. A label meaning zero belongs in the calculation; a label meaning unknown needs different handling.
- Watch numbers stored as text. In a referenced range, a text number counts as zero. Convert it to a real number before calculating if you need its numeric value.
- Direct text arguments behave differently. A numeric text argument is interpreted as a number when typed directly into VARA. Non-numeric text supplied directly produces
#VALUE!. - A blank-looking cell may still count. Truly empty cells are ignored, but formulas returning empty text count as zero. That difference changes which observations enter the variance.
- Check for too little data. VARA returns
#DIV/0!when given a single observation or an all-blank range. Check how many observations remain after empty cells are ignored. - Choose sample or population deliberately. VARPA calculates population variance while including text and logical values. Use it instead of VARA when your records cover the entire population you want to describe.
Before using VARA on a survey column, check that each text label really means zero. Keep missing-response notes separate from recorded answers.
Related Excel Functions / Articles:
