
The VAR function in Excel estimates variance from a sample of numbers.
It measures spread around the sample mean in squared units. VAR is retained for compatibility; VAR.S is its modern equivalent, while VAR.P is for an entire population.
In this article, I’ll show you how to calculate sample variance, compare it with population variance, and analyze a filtered subset.
VAR Function Syntax in Excel
Here is how you write the VAR function.
=VAR(number1, [number2], ...)
- number1 (required) – the first value, cell, or range in your sample.
- number2, … (optional) – up to 254 more values or ranges, all treated as one sample.
VAR computes the SAMPLE variance, which means it divides by n-1, where n is the count of numbers.
When to Use VAR Function
VAR is handy in a few common situations:
- Estimating how spread out a sample is when you only have part of the data.
- Tracking variability in quality-control measurements.
- Comparing the consistency of two groups (lower variance means more consistent).
- Feeding risk or volatility analysis, where spread matters more than the average.
- Acting as the basis for standard deviation, which is just the square root of variance.
Example 1: Find the variance of a data set
Let’s start with the simplest case, a single column of numbers.
Below is the dataset, with student names in column A (A2:A7) and their test scores in column B (B2:B7). A “Variance” label sits in D1, and the result goes in D2.
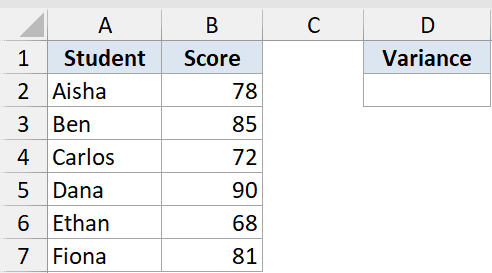
We want the sample variance of the six scores.
Here is the formula:
=VAR(B2:B7)
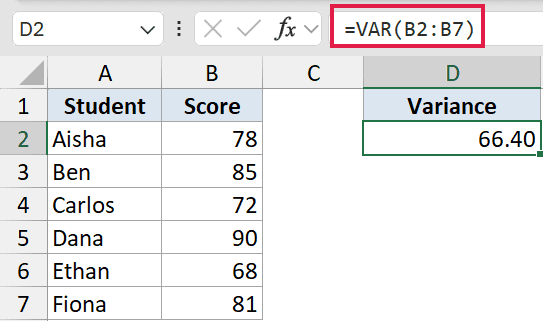
How this formula works:
VAR takes the six scores, finds how far each one sits from the average (79), squares those gaps, adds them up, and divides by n-1 (here that is 5). The result is 66.4.
That 66.4 is in “points squared”, which is why variance can feel hard to read on its own.
Pro Tip: Variance is in squared units, so wrap it in SQRT to get a number in the original units. For example, =SQRT(VAR(B2:B7)) gives about 8.15 points.
Example 2: Sample variance vs population variance
Now let’s see how VAR compares to its population cousin, VARP.
Below is the dataset, with the day of the week in column A (A2:A8) and daily sales in column B (B2:B8). To the right, column D holds a “Measure” label and column E holds the “Result”, with rows for “Sample (VAR)” and “Population (VARP)”.
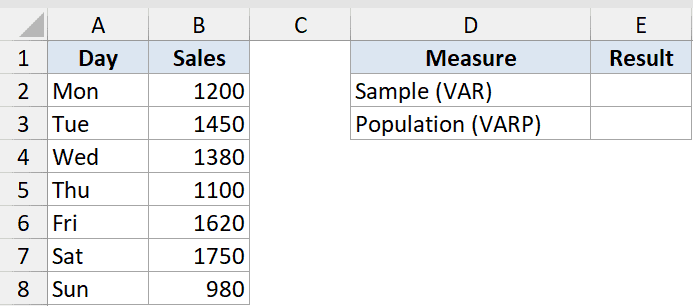
We want to see how sample variance (VAR) differs from population variance (VARP) on the same numbers.
Here is the formula:
=VAR(B2:B8)
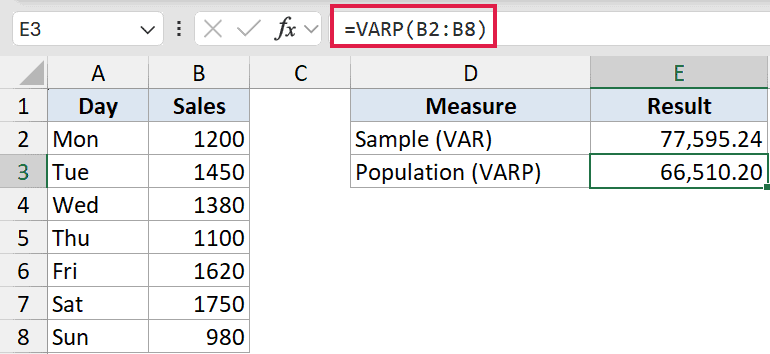
How this formula works:
- VAR divides by n-1, treating the 7 days as a sample of all possible days. It returns 77,595.24.
- VARP, using
=VARP(B2:B8), divides by n instead, treating the 7 days as the whole population. It returns 66,510.20. - Sample variance is always the larger of the two, because dividing by the smaller denominator (n-1) makes the number bigger.
VAR still works and returns the same result, but in new workbooks reach for VAR.S, the modern name for sample variance, and VAR.P for population. Same numbers, clearer names.
Example 3: VAR ignores text and blank cells
Here’s a case that trips people up, a column with stray text and a blank cell mixed in.
Below is the dataset, with reading labels in column A (A2:A8) and their values in column B (B2:B8). A “Variance” label sits in D1 with the result in D2.
Column B deliberately has a blank cell and a text entry: 20.4, 21.1, blank, 19.8, “error”, 20.9, 21.5.
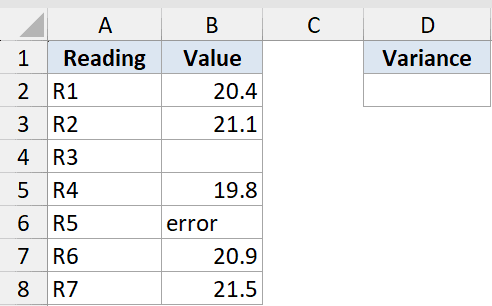
We want the variance of the readings even though the column has a blank and a text entry.
Here is the formula:
=VAR(B2:B8)
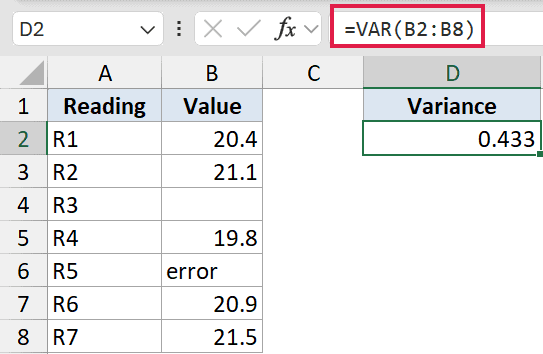
How this formula works:
VAR silently skips the blank cell and the text “error”, so it only uses the 5 real numbers. That means n is 5, not 7, and the result is 0.433.
Because skipped cells change n, double-check that a column isn’t hiding notes or blanks you actually meant to include.
Pro Tip: If you actually need text and logical values counted (text as 0, TRUE as 1), use VARA instead. It usually inflates the variance, so only use it when you really want those cells in the math.
Example 4: Variance of a subset with FILTER
Let’s step it up and measure the variance of just one group inside a bigger list.
Below is the dataset, with the region in column A (West and East alternating, A2:A13) and units sold in column B (B2:B13). A “West Variance” label sits in D1 with the result in D2.
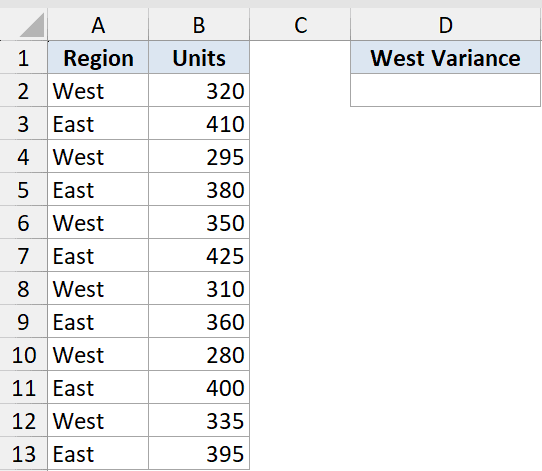
We want the variance of only the West region’s units, without adding a helper column.
Here is the formula:
=VAR(FILTER(B2:B13,A2:A13="West"))
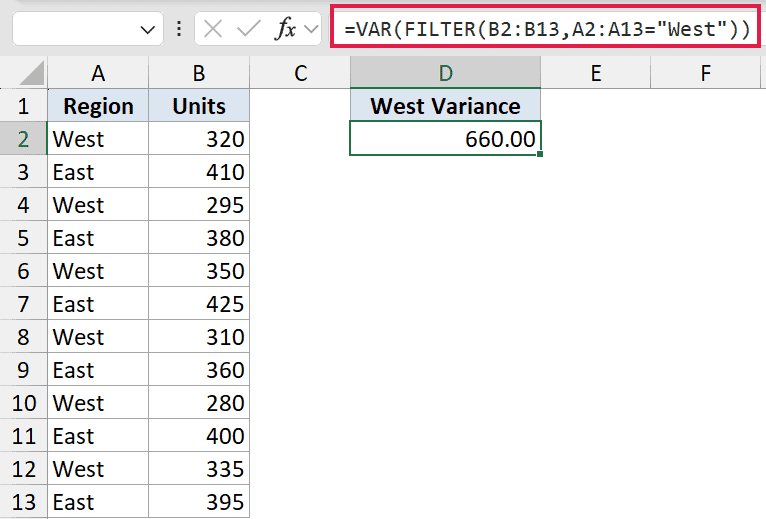
How this formula works:
- FILTER pulls just the West rows (320, 295, 350, 310, 280, 335) and spills them into memory.
- VAR then reduces that spilled subset down to a single variance, which comes out to 660.00.
- This is the modern replacement for the old array-CSE trick, no Ctrl+Shift+Enter needed.
Swap “West” for “East” to compare the two regions, and use VAR.S inside FILTER for the future-proof version.
Tips & Common Mistakes
- VAR vs VAR.S vs VARP vs VAR.P: VAR equals VAR.S (sample, divides by n-1), and VARP equals VAR.P (population, divides by n). The legacy and modern names return identical numbers.
- Text and logical values inside a referenced range are ignored, which quietly changes n and shifts your result.
- VAR needs at least two numbers, or it returns #DIV/0!, because the n-1 denominator becomes 0.
- Variance is in squared units. Take SQRT(VAR(…)) or use STDEV.S for a number people can actually read.
- VAR is a legacy function. Prefer VAR.S in new workbooks, since Microsoft warns VAR may go away someday.
Variance tells you how spread out your numbers are, and VAR gives you the sample version in one step.
Remember it ignores text and blanks, needs at least two numbers, and reports in squared units. For a readable figure, take the square root or switch to STDEV.S, and lean on VAR.S for new work.
Related Excel Functions / Articles:
- DEVSQ Function in Excel
- Variance Calculator
- Standard Deviation Calculator
- Calculate the Coefficient of Variation in Excel
- How to Calculate Covariance in Excel?
- Standard Error Calculator
- Calculate the Population Mean in Excel
- How to Calculate Standard Error in Excel?
- Cronbach’s alpha formula in Excel
