
The DSTDEVP function in Excel calculates the population standard deviation of values in a database field after applying criteria.
DSTDEVP is the function to use when the matching records are the complete group being described. Filtering a list does not automatically make those records a sample.
In this article, I’ll show you how to apply AND and OR criteria, compare population and sample results, and guard against the one-record zero.
DSTDEVP Function Syntax in Excel
DSTDEVP needs a database, the field you want to measure, and a separate criteria range.
=DSTDEVP(database, field, criteria)
- database (required) is the complete list, including its header row.
- field (required) identifies the column to measure. Use its header in quotes or its column number.
- criteria (required) is a range containing a matching database header and at least one condition below it.
When to Use DSTDEVP Function
- Measure variation for a complete production group that meets one or more conditions.
- Apply AND conditions by placing criteria on the same row.
- Apply OR conditions by placing alternatives on separate rows.
- Compare consistency across complete groups without adding helper columns to the database.
- Return population standard deviation in the same units as the measured field.
Example 1: Population Standard Deviation by Line
Let’s start with one criterion and a complete production log.
Below is the dataset. Columns A:D hold every gauged coil, F1:F2 contains the line criterion, and H has a green result header over an empty bordered answer cell.
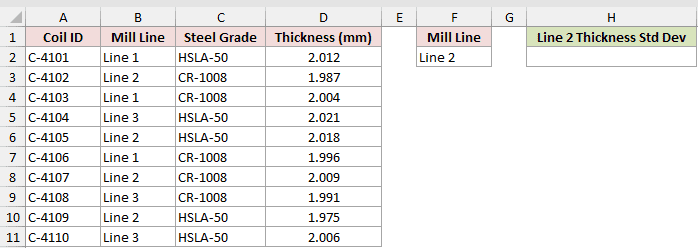
We want the population standard deviation of thickness for every Line 2 coil in the log.
Here is the formula:
=DSTDEVP(A1:D11,"Thickness (mm)",F1:F2)
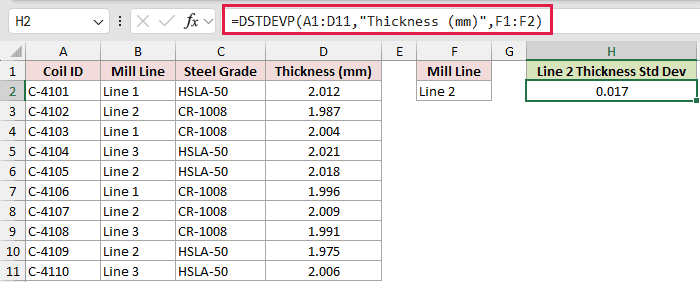
A1:D11 is the database, "Thickness (mm)" selects the measured field, and F1:F2 supplies the Mill Line criterion.
Excel returns 0.017 mm. The result stays in the same units as the thickness values.
Example 2: Apply Two AND Criteria
Now let’s narrow a complete roll log by machine and shift.
Below is the dataset. Columns A:D hold every tested roll, F1:G2 contains the two criteria, and I has a green result header over an empty bordered answer cell.
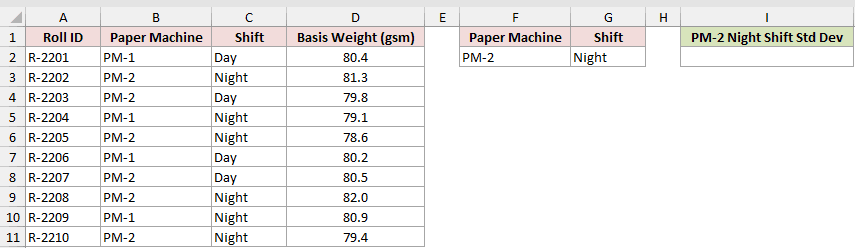
We want the population standard deviation for rolls made on PM-2 during the Night shift.
Here is the formula:
=DSTDEVP(A1:D11,"Basis Weight (gsm)",F1:G2)
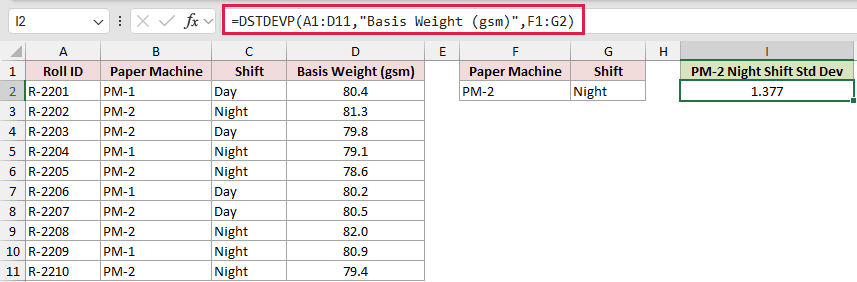
Paper Machine and Shift sit on the same criteria row, so both conditions must be true.
The matching Night-shift rolls have a population standard deviation of 1.377 gsm.
Example 3: Combine Groups With OR Criteria
Here’s how separate criteria rows can pool two complete groups.
Below is the dataset. Columns A:D hold every checked batch, F1:F3 contains two mixer criteria rows, and H has a green result header over an empty bordered answer cell.
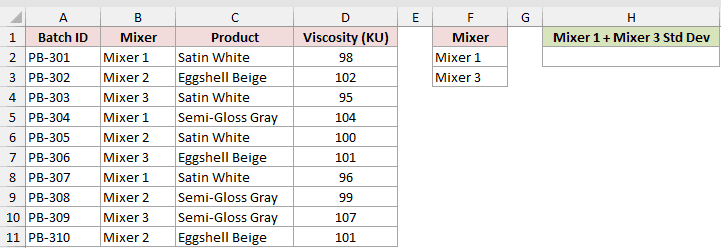
We want the population standard deviation of viscosity across Mixer 1 or Mixer 3 batches.
Here is the formula:
=DSTDEVP(A1:D11,4,F1:F3)
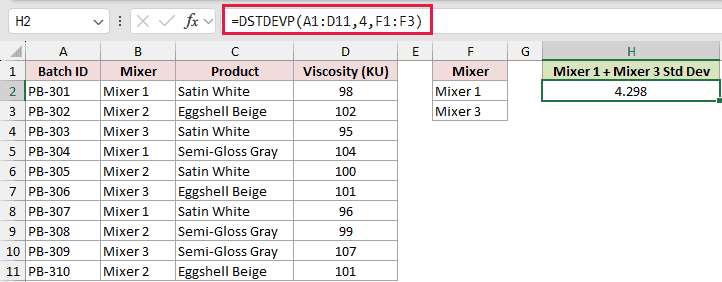
The separate criteria rows mean OR. A batch can come from Mixer 1 or Mixer 3.
The field argument 4 selects the fourth database column, Viscosity. Excel returns 4.298 KU for the pooled population.
That pooled result is not the average of each mixer’s standard deviation. DSTDEVP recalculates variation across all matching values together.
Example 4: Compare Variation by Temperature
Next, we’ll compare complete groups while filtering a different column from the one being measured.
Below is the dataset. Columns A:D hold every slump-tested load, F and H contain temperature criteria, and J:K has green result headers over empty bordered answer cells.
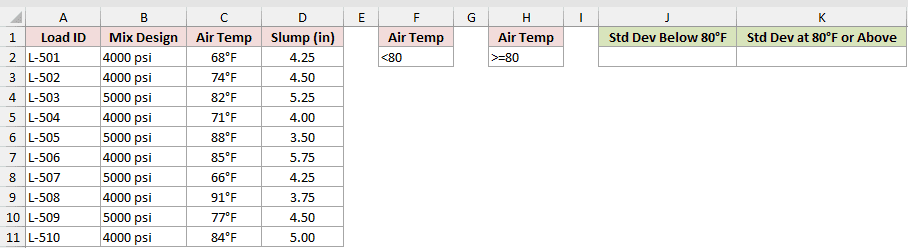
We want separate population standard deviations for loads below 80°F and loads at 80°F or above.
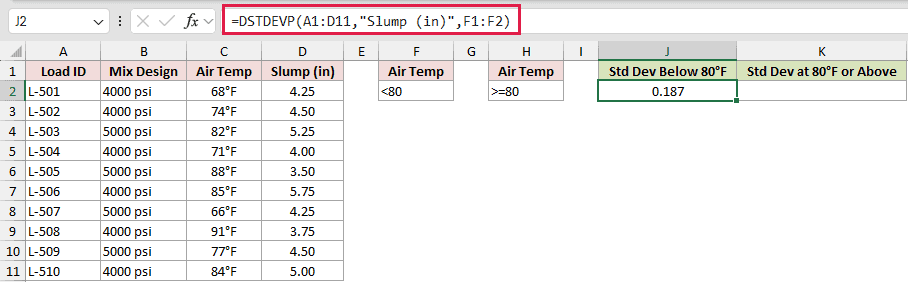
Here is the formula for loads below 80°F:
=DSTDEVP(A1:D11,"Slump (in)",F1:F2)
And here is the formula for loads at 80°F or above:
=DSTDEVP(A1:D11,"Slump (in)",H1:H2)
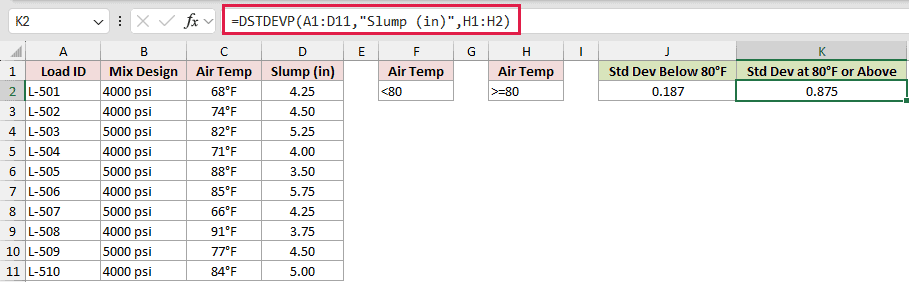
The cooler loads, at 0.187 inches, are the more consistent group. The hotter loads return 0.875 inches.
The criteria inspect Air Temp, but both formulas measure Slump. The °F suffix comes from number formatting, so the underlying temperatures remain numbers.
Example 5: Compare DSTDEVP With DSTDEV
This example makes the population-versus-sample choice visible on the same records.
Below is the dataset. Columns A:D hold every weighed cheese wheel, F1:F2 selects Cave 2, and H:I has green result headers over empty bordered answer cells.
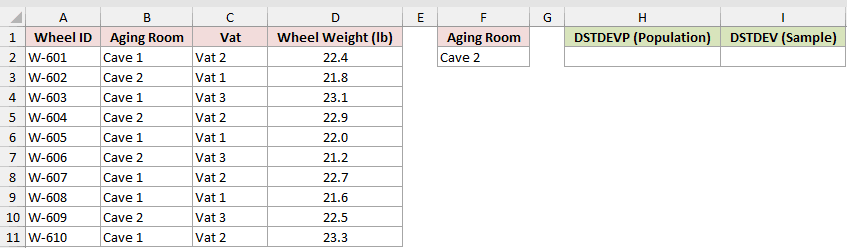
We want to compare population and sample standard deviation for the same complete Cave 2 group.
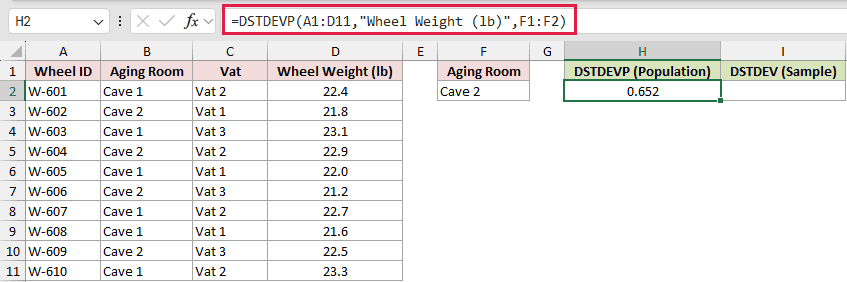
Here is the DSTDEVP formula:
=DSTDEVP(A1:D11,"Wheel Weight (lb)",F1:F2)
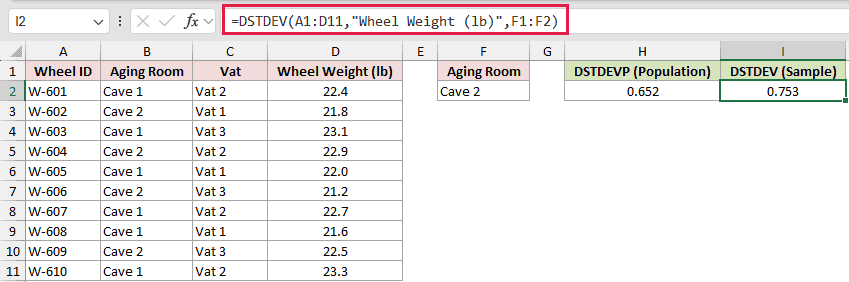
For comparison, here is the DSTDEV formula on the same records:
=DSTDEV(A1:D11,"Wheel Weight (lb)",F1:F2)
DSTDEVP returns 0.652 lb. That is the appropriate result because the log contains every Cave 2 wheel being described.
The DSTDEV comparison returns 0.753 lb. It divides by n-1, so it is larger and suits records used to estimate a bigger population.
Pro Tip: Filtering does not decide whether data is a sample. Use DSTDEVP when the matches are the complete group, and DSTDEV when they represent a larger group or future output.
Example 6: Guard Against the One-Record Zero
Now let’s look at the quietest DSTDEVP mistake.
Below is the dataset. Columns A:D hold every weighed casting, F1:F2 selects the lone Valve Body, and H:J has green result headers over empty bordered answer cells.
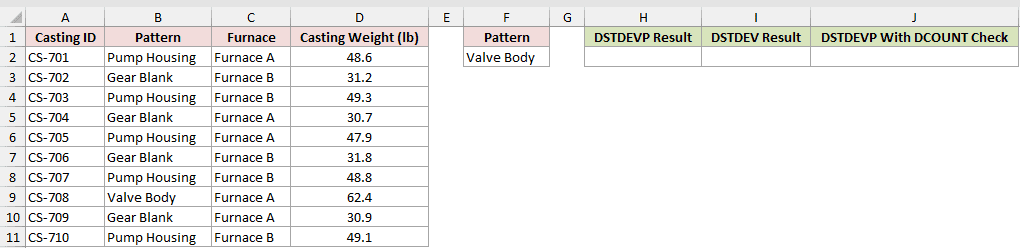
We want to expose the one-record behavior, compare it with DSTDEV, and add a safer check.
First, here is the unguarded DSTDEVP formula:
=DSTDEVP(A1:D11,"Casting Weight (lb)",F1:F2)
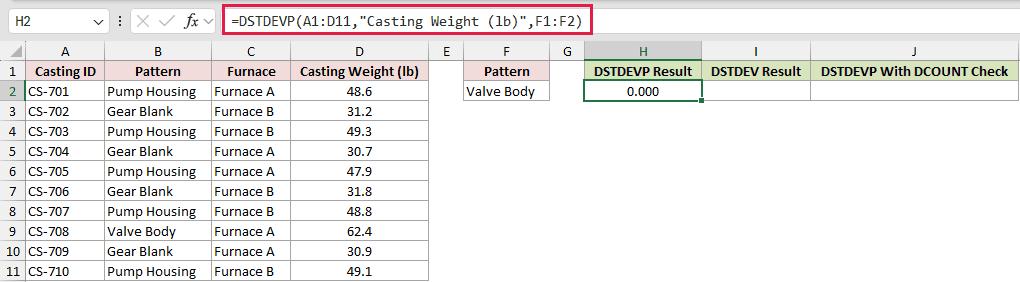
The 0.000 in H2 is the trap. It means only one casting matched, not that repeated Valve Body castings are perfectly consistent.
For comparison, the sample function makes the shortage visible:
=DSTDEV(A1:D11,"Casting Weight (lb)",F1:F2)
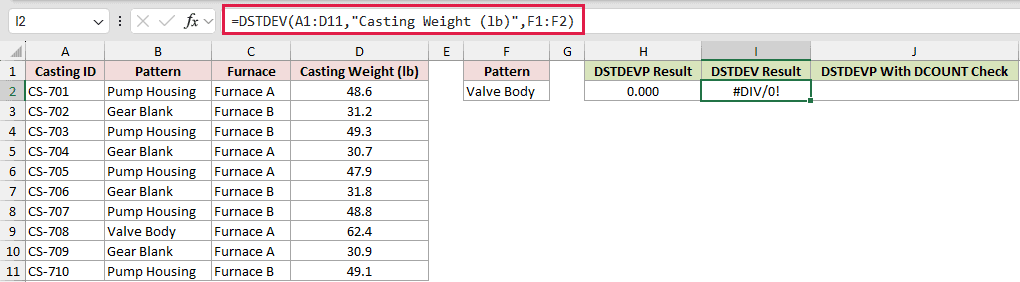
The comparison cell I2 returns #DIV/0! because sample standard deviation needs more than one matching value.
Here is the guarded formula:
=IF(DCOUNT(A1:D11,"Casting Weight (lb)",F1:F2)<2,"Need 2+ castings",DSTDEVP(A1:D11,"Casting Weight (lb)",F1:F2))
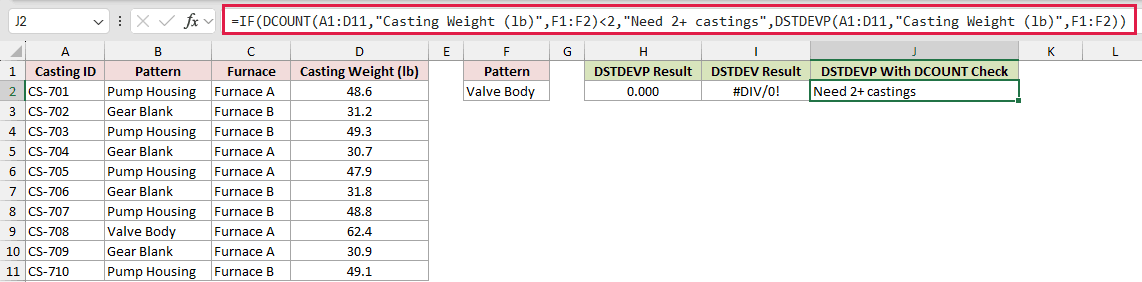
DCOUNT counts numeric weights that meet the criteria. When fewer than two match, the formula returns “Need 2+ castings” instead of a misleading result.
If nothing matches, both DSTDEVP and DSTDEV return #DIV/0!. The same DCOUNT check handles that case too.
Example 7: Calculate Each Group With FILTER
Finally, let’s build a compact per-kiln summary without separate criteria ranges.
Below is the dataset. Columns A:D hold every metered kiln load, F2:F4 contains the typed kiln labels, and G has a green result header over empty bordered answer cells.
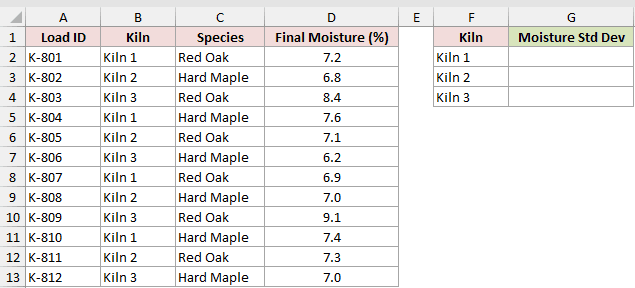
We want one population standard deviation beside each kiln listed in column F.
Enter this formula in G2 and copy it down through G4:
=STDEV.P(FILTER($D$2:$D$13,$B$2:$B$13=F2))
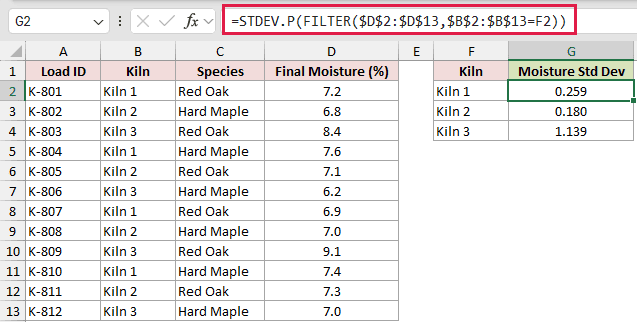
FILTER selects the moisture values for the kiln in F2. STDEV.P then reduces that complete group to one population standard deviation.
The copied formulas return 0.259 for Kiln 1, 0.180 for Kiln 2, and 1.139 for Kiln 3.
Excel has no STDEVIFS function. This FILTER route works in Excel 2021, Excel 2024, and Microsoft 365.
Tips & Common Mistakes
- Include the database’s header row in the
databaseargument. The criteria header must match a database header exactly. - A misspelled field name returns
#VALUE!. You can also use the field’s column number, but a header name is safer if columns may move. - Put AND conditions on the same criteria row and OR alternatives on separate rows.
- Plain text criteria match from the start of a cell. Use
="=text"when you need an exact text match. - Keep criteria ranges beside the database. Placing them below the list can cause new database rows to overlap them.
- Text entries in the measured field are skipped, so check that the remaining numbers still represent the complete population you intend to describe.
- DSTDEVP is available in every current version of Excel. It returns one value rather than spilling because it reduces all matching records to one result.
- Standard deviation uses the field’s original units. DVARP returns the corresponding population variance in squared units.
Keep each result beside its criteria block so the logic is easy to audit.
For repeated group summaries, the FILTER approach keeps the worksheet compact.
Related Excel Functions / Articles:
