
Excel’s DVARP function returns the population variance of numbers in a database column, using only the records that match your criteria. Variance measures how spread out those numbers are.
Use it when those matching records contain the whole group you want to describe. Selecting one wind farm from a complete turbine register still gives you a population.
DVARP Function Syntax in Excel
The DVARP function takes three required arguments:
=DVARP(database,field,criteria)
- database: The range containing your records, including the column headers in its first row.
- field: The column to calculate variance for. Use its header in double quotes or its position within the database, starting at 1.
- criteria: The range containing a criteria header and the condition below it. For ordinary criteria, the header must match the corresponding database header.
When to Use DVARP Function
- Calculate output variance for every asset at a selected site.
- Apply multiple conditions, such as a location and equipment type, before calculating population variance.
- Combine records from two groups into one population using OR criteria.
- Compare variability between complete groups, such as newer and older batteries.
Example 1: Calculate Variance for One Wind Farm
Let’s start with a complete register of wind turbines.
Below is the dataset showing turbine IDs, wind farms, models, August output, the Mesa Ridge criterion, and empty labeled result cells in H2:I2.
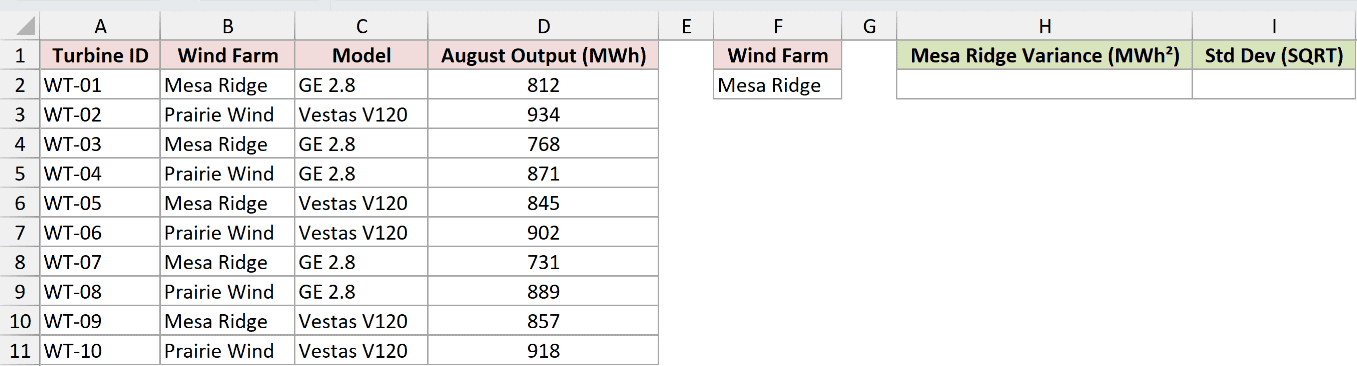
We want the population variance of August output for all five Mesa Ridge turbines, with the result in H2.
Here is the formula:
=DVARP(A1:D11,"August Output (MWh)",F1:F2)
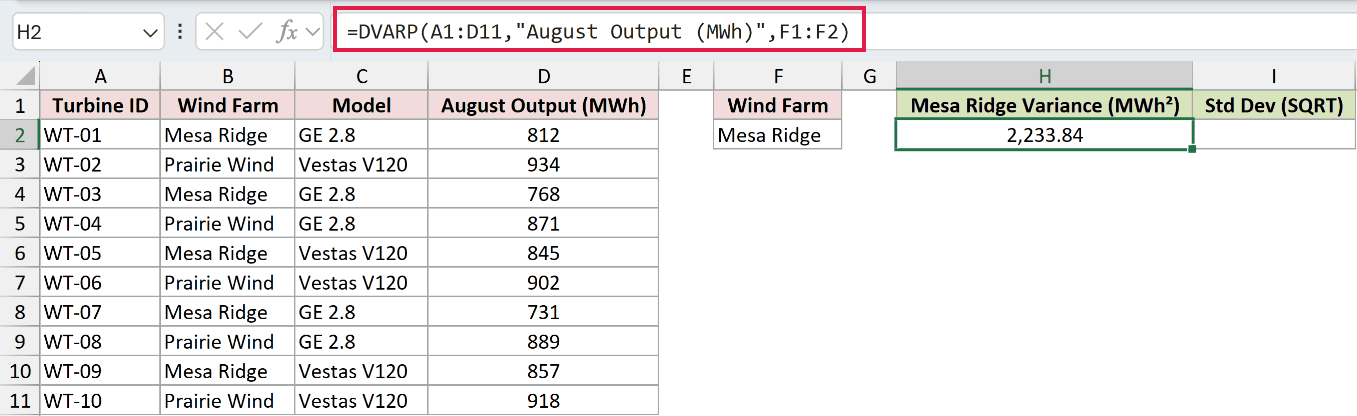
Excel uses the Wind Farm header in F1 and Mesa Ridge in F2 to select outputs of 812, 768, 845, 731, and 857.
The result is 2,233.84 MWh². DVARP measures each output’s squared distance from the group’s mean, then averages those squared distances across the five turbines.
In I2, enter =SQRT(H2) to get the population standard deviation of 47.26 MWh. You can compare this directly with the original output readings.
Pro Tip: If you only need population standard deviation, DSTDEVP calculates it directly with the same database, field, and criteria arguments.
Example 2: Apply Two Conditions with AND
Now let’s narrow the calculation to one equipment type at one site.
Below is the dataset showing solar arrays, sites, mount types, daily output, criteria in F1:G2, and the empty labeled result cell I2.
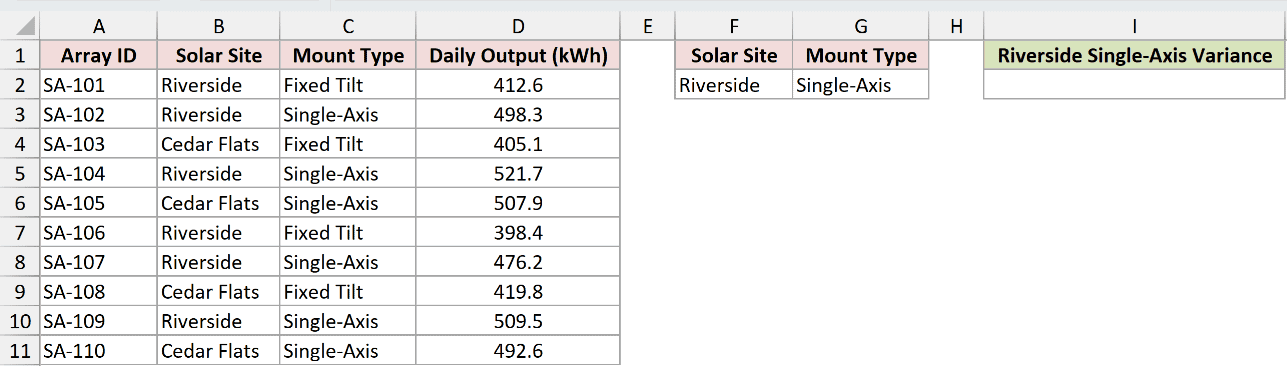
We want the variance of daily output for every Single-Axis array at Riverside, calculated in I2.
Here is the formula:
=DVARP(A1:D11,"Daily Output (kWh)",F1:G2)
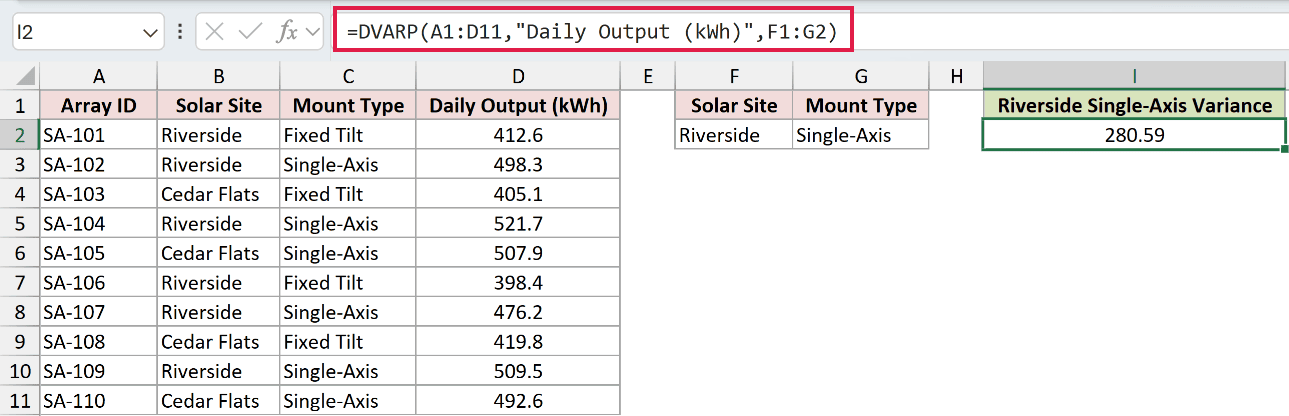
How this formula works:
A1:D11contains the complete array register and its headers."Daily Output (kWh)"selects the measurements in column D.- F2 contains
Riverside, and G2 containsSingle-Axis. Conditions on the same criteria row must both be met. - The matching outputs are 498.3, 521.7, 476.2, and 509.5. Their population variance displays as 280.59 kWh².
This describes output variability within the selected site and mount type. Fixed Tilt arrays at Riverside and all Cedar Flats arrays are excluded.
Example 3: Combine Two Garages with OR
You can also include records that meet either of two conditions.
Below is the dataset showing chargers, garages, charger types, weekly sessions, two garage criteria in F2:F3, and the empty labeled result cell H2.
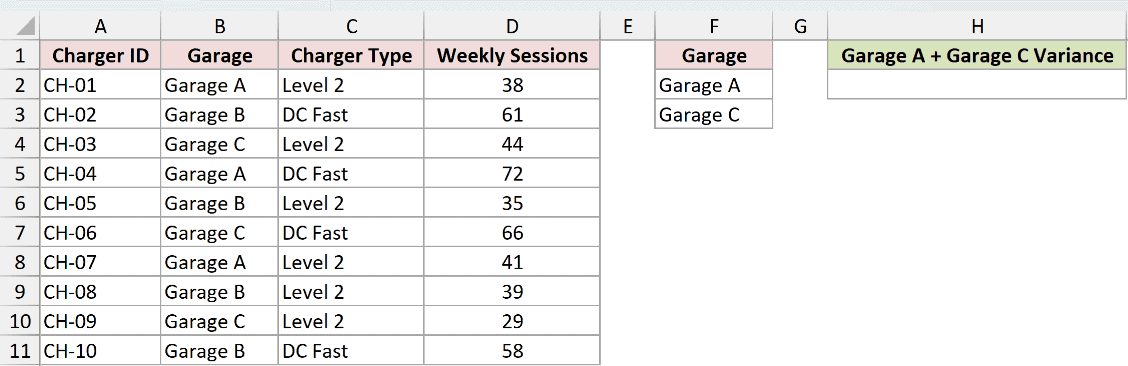
We want one population variance for all chargers in Garage A or Garage C, returned in H2.
Here is the formula:
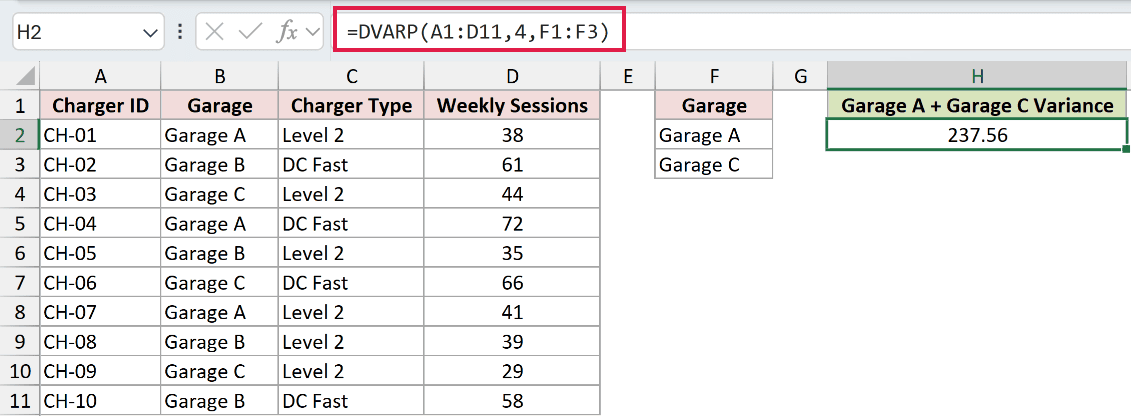
=DVARP(A1:D11,4,F1:F3)
How this formula works:
4selects the fourth column ofA1:D11, which isWeekly Sessions.- F1 contains the header
Garage. F2 and F3 containGarage AandGarage Con separate rows, creating an OR condition. - Excel combines the six matching values: 38, 44, 72, 66, 41, and 29.
- H2 displays 237.56, measured in sessions squared.
Pro Tip: A combined population’s variance is not generally the average of the separate group variances. Use the pooled records when your question concerns both garages together.
Example 4: Compare Battery Age Groups
Numeric criteria let you compare groups on opposite sides of a cutoff.
Below is the dataset showing battery IDs, sites, ages, retained capacity, separate age criteria, and empty labeled result cells in J2:K2.
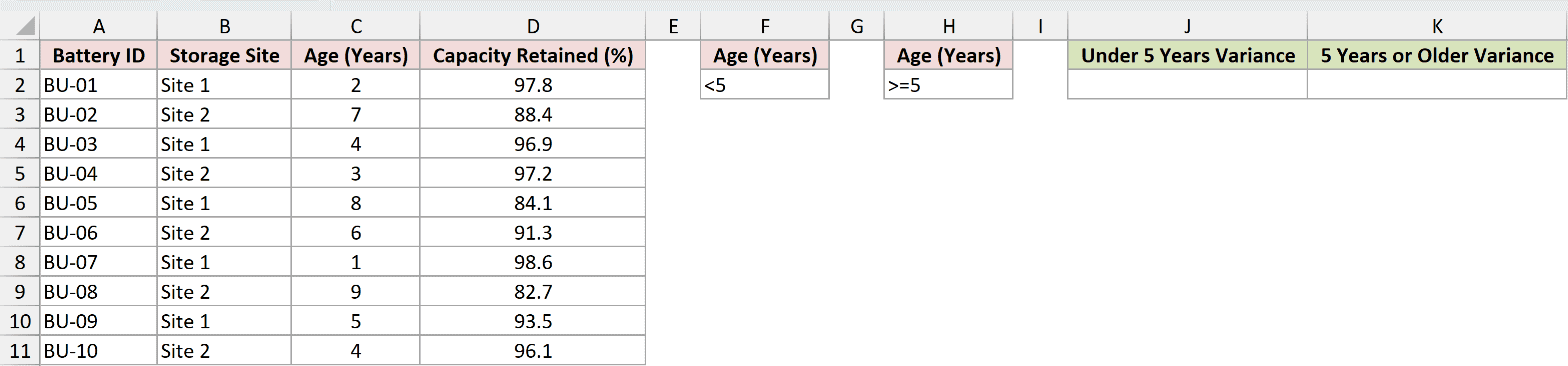
We want to compare retained-capacity variance for all batteries under five years old with all batteries aged five years or older.
Here is the formula:
=DVARP(A1:D11,"Capacity Retained (%)",F1:F2)
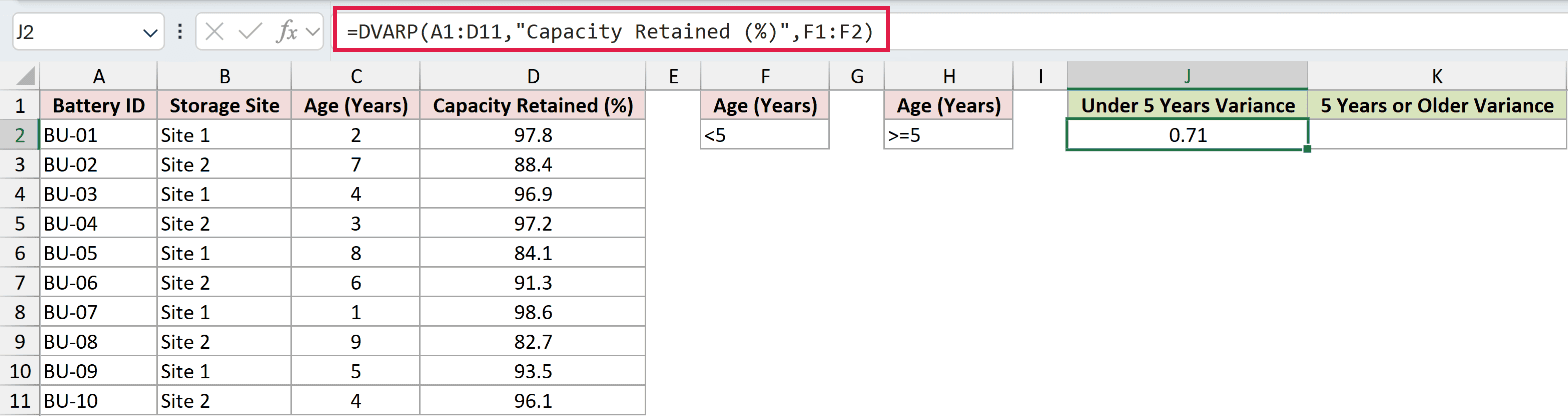
Enter it in J2. F1 contains Age (Years), and F2 contains <5, so the condition selects the five younger batteries.
Their retained-capacity readings are 97.8, 96.9, 97.2, 98.6, and 96.1. The population variance is 0.7096, displayed as 0.71.
For the older group, enter this formula in K2:
=DVARP(A1:D11,"Capacity Retained (%)",H1:H2)
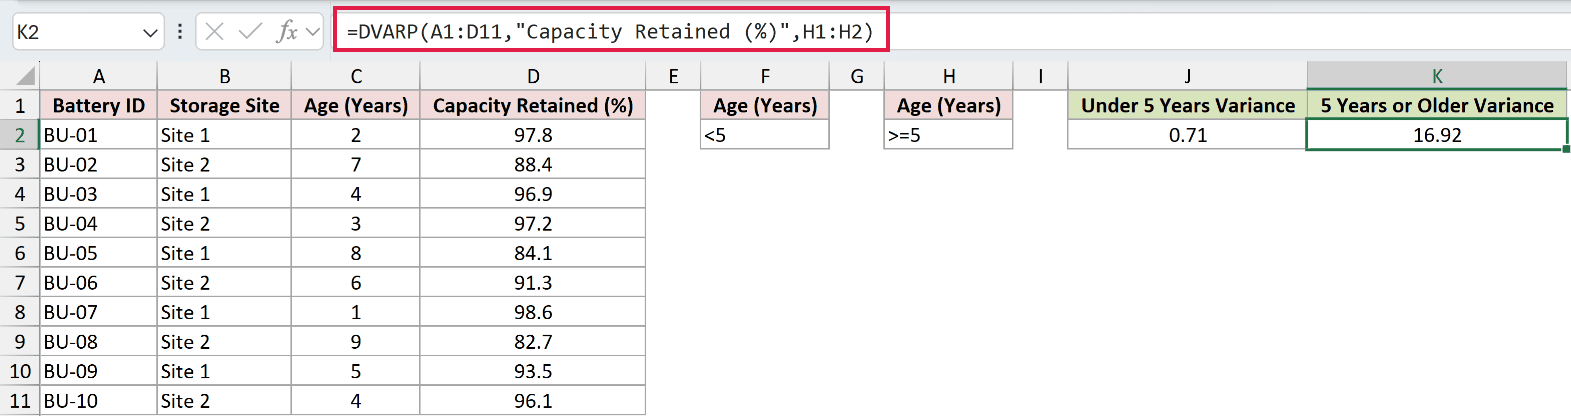
H1 repeats Age (Years), with >=5 in H2. The selected readings are 88.4, 84.1, 91.3, 82.7, and 93.5.
K2 returns 16.92. Retained capacity varies more across the older batteries in this register.
Pro Tip: These capacity readings are stored as numbers such as 97.8, meaning 97.8%. The variances are in percentage points squared. Keep the result cells in Number format.
Example 5: Choose Between DVARP and DVAR
The right function depends on what your records represent.
Below is the dataset showing transformers, substations, ratings, peak loads, a Substation South criterion, and empty labeled population and sample result cells in H2:I2.
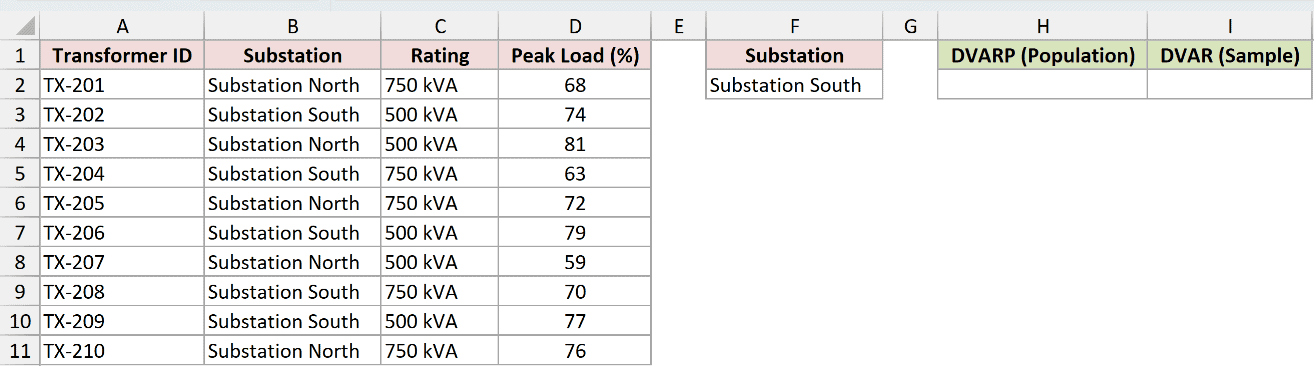
We want to compare population and sample variance for the same five Substation South transformers.
Here is the formula:
=DVARP(A1:D11,"Peak Load (%)",F1:F2)
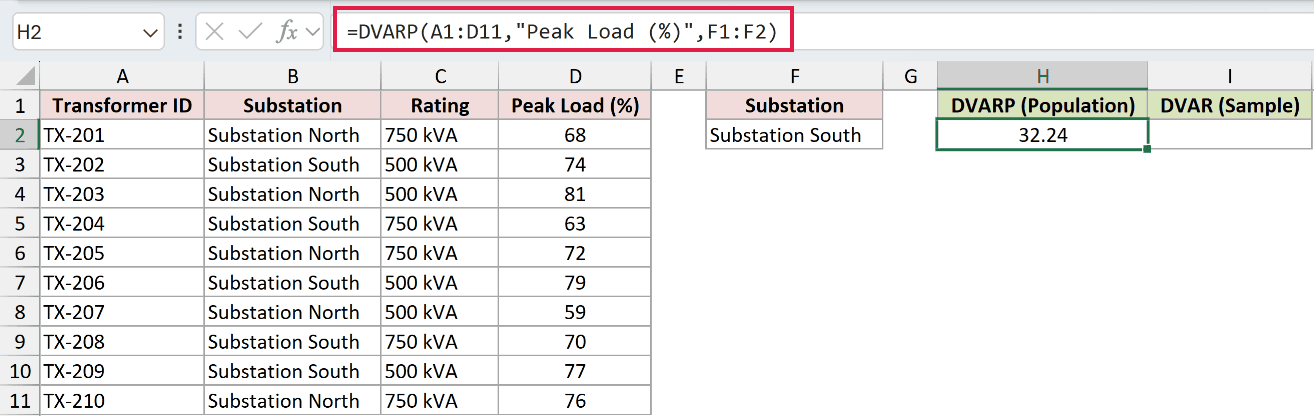
Entered in H2, DVARP returns 32.24. The matching peak loads are 74, 63, 79, 70, and 77.
For sample variance, enter =DVAR(A1:D11,"Peak Load (%)",F1:F2) in I2. It returns 40.30.
Both formulas use the same five values. DVARP divides the squared deviations by 5, while DVAR divides by 4.
Use DVARP to describe these five transformers when they are every transformer at Substation South. The variance is in percentage points squared.
Use DVAR if these five transformers are a sample used to estimate variability across a larger population. Filtering a register doesn’t itself make the matches a sample.
Example 6: Check a One-Match Zero Result
A zero variance can come from a group containing just one record.
Below is the dataset showing pumps, stations, types, weekly run hours, a Booster criterion, and empty labeled result cells in H2:J2.
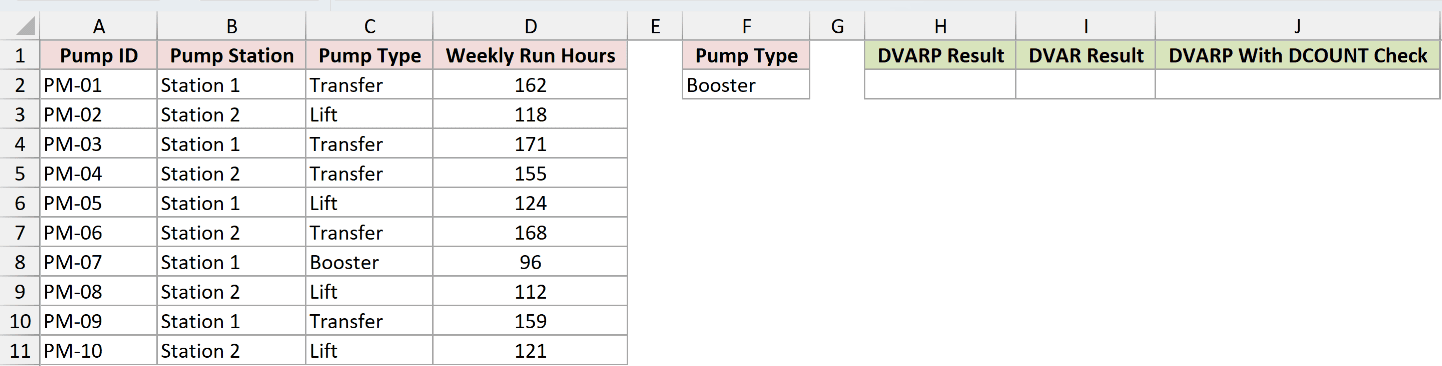
We want to calculate variance for Booster pumps and flag a group too small to compare multiple pumps.
Here is the formula:
=DVARP(A1:D11,"Weekly Run Hours",F1:F2)
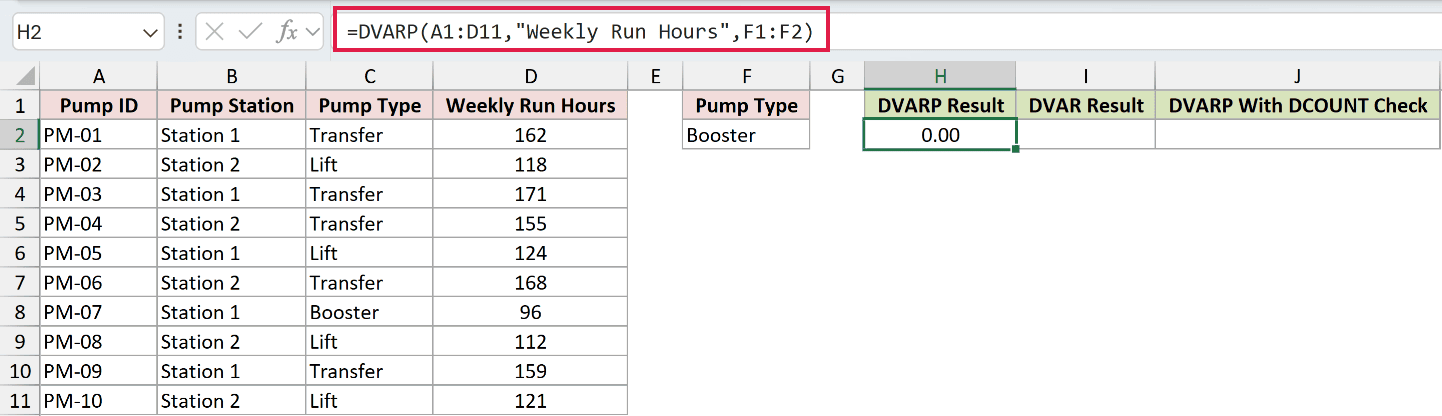
H2 displays 0.00. Only PM-07 matches Booster, with 96 weekly run hours. A population containing one value has no deviation from its own mean.
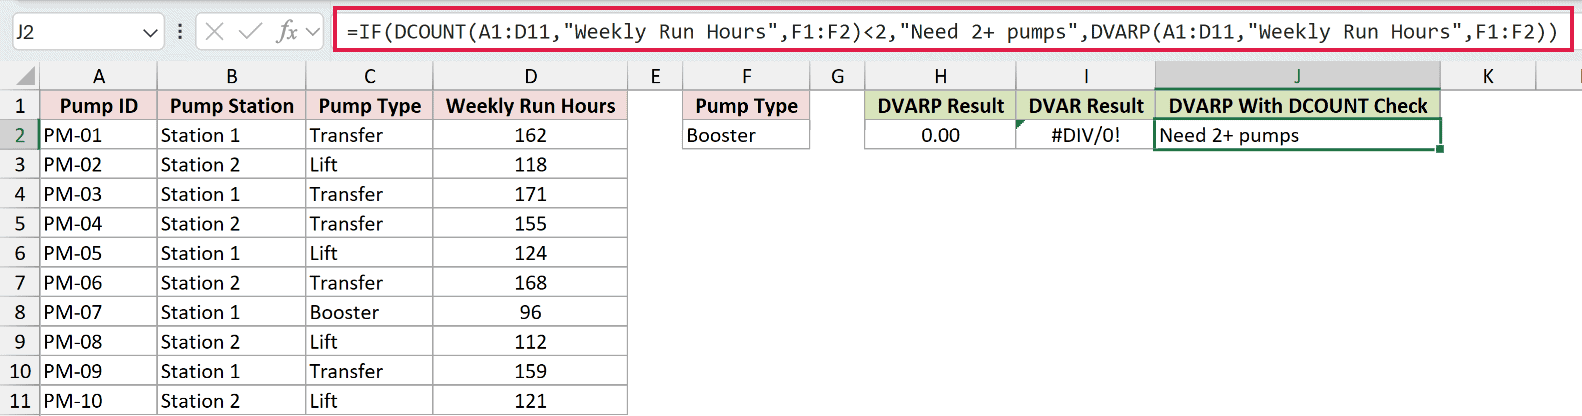
In I2, =DVAR(A1:D11,"Weekly Run Hours",F1:F2) returns #DIV/0!.
DVAR divides by the matching count minus one. With only one numeric value, that means dividing by zero.
To require at least two pumps for this report, enter the following in J2:
=IF(DCOUNT(A1:D11,"Weekly Run Hours",F1:F2)<2,"Need 2+ pumps",DVARP(A1:D11,"Weekly Run Hours",F1:F2))
How this formula works:
DCOUNTcounts numeric entries inWeekly Run Hoursthat meet the same criteria.- If that count is below 2,
IFreturns Need 2+ pumps, which is the result here. - Otherwise, it calculates DVARP for the matching pumps. A group with no numeric matches also triggers the message.
Pro Tip: You can set a two-pump minimum to suit your report. The one-pump zero is mathematically valid, but it tells you nothing about differences between pumps.
Example 7: Summarize Variance by Well Field
For a summary with several groups, FILTER offers another way to select the values.
Below is the dataset showing wells, fields, depths, daily pumping, three field names in F2:F4, and empty result cells under Pumping Variance in G2:G4.
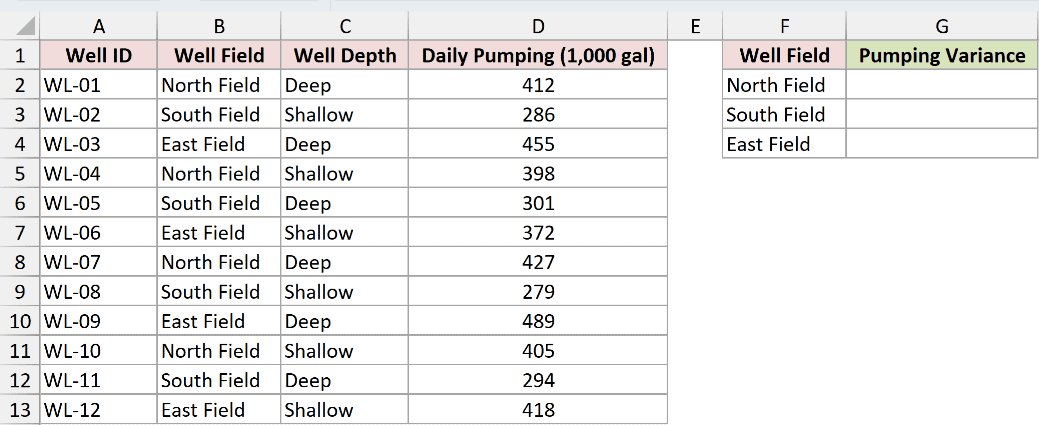
We want a separate population variance for every well field without setting up a separate database criteria block for each one.
Here is the formula:
=VAR.P(FILTER($D$2:$D$13,$B$2:$B$13=F2))
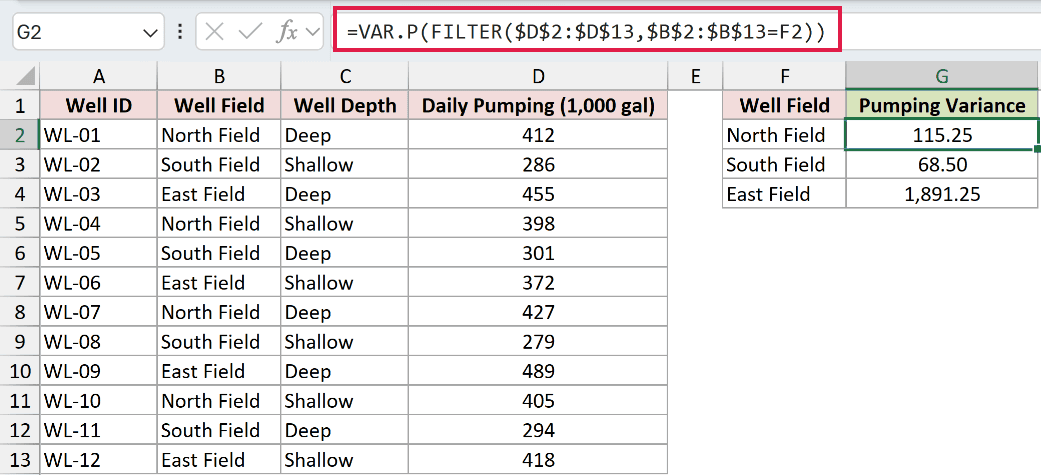
Enter it in G2, then fill down through G4. This approach uses FILTER, available in Excel 2021, Excel 2024, and Microsoft 365.
How this formula works:
FILTERselects daily pumping values from$D$2:$D$13where the field in$B$2:$B$13matches F2.VAR.Pcalculates population variance from those selected values and returns one number.- The dollar signs keep both data ranges fixed during fill-down. The group reference changes from F2 to F3, then F4.
- G2 returns 115.25 for North Field, G3 displays 68.50 for South Field, and G4 displays 1,891.25 for East Field.
Each field has four wells. East Field has the greatest variability in daily pumping across its wells, while South Field has the least.
The units are thousands of gallons squared. VAR.P reduces the array from FILTER to one number, so the result stays in a single cell.
Pro Tip: DVARP remains useful when your conditions already live in worksheet cells, and it works in older Excel versions. In Excel 2019 and earlier, use the database criteria approach from the earlier examples.
Tips & Common Mistakes
- Choose the population deliberately. DVARP fits a complete group. Use DVAR when the matching records represent a sample of a larger population.
- Include headers in the database range. Ordinary criteria headers must match database headers, and quoted field names must match the column you want to measure.
- Check the criteria layout. Conditions on one row use AND. Conditions on separate rows use OR. An extra blank criteria row can unintentionally broaden the selection.
- Keep criteria beside the database. Avoid overlapping the data or placing criteria directly below a list that may grow.
- Remember text matching. Plain text criteria use begins-with matching. If your labels share prefixes, use an exact-text criterion to avoid including extra groups.
- Read the units correctly. Variance uses squared units. Take its square root when you need standard deviation in the original units.
- Check how many values matched. A DVARP result of zero can describe a one-value population. Use a DCOUNT check when your report requires multiple observations.
DVARP lets you keep selection rules visible on the worksheet while calculating variance for a complete group.
Check the matching records and the result’s units before interpreting how much the values vary.
Other Excel articles you may also like:
