
The STDEVPA function in Excel returns the population standard deviation, including text and logical values in cell references. Standard deviation describes how spread out values are around their average.
Use it when your list represents the entire group you’re describing. Text counts as zero, so a label such as “Closed” can represent a day with no sales.
That same behavior causes problems when text means missing information. A note saying “Not reported” isn’t a zero score, even though STDEVPA treats it that way.
Let’s start with a case where counting text as zero makes sense.
STDEVPA Function Syntax in Excel
STDEVPA accepts values, cell references, or ranges:
=STDEVPA(value1, [value2], ...)
- value1 (required): The first value or range representing the population.
- value2, … (optional): Additional values or ranges to include in the same calculation.
A population means the complete group you want to describe. STDEVPA divides by the count of included values when calculating the population variance, then takes its square root.
For a worksheet range, the input rules are:
- Numbers count at their numeric values.
TRUEcounts as 1.FALSEand text count as 0, including numbers stored as text.- Truly empty cells are ignored.
- A formula returning an empty string counts as text, so it contributes 0.
When to Use STDEVPA Function
- Measure daily sales variation across a complete period when “Closed” means no sales.
- Compare the spread of TRUE/FALSE records across a full reporting period.
- Describe a complete set of measurements where every text marker deliberately represents zero.
Example 1: Include Closed Days in Sales Variation
Let’s start with a food truck that records closed days as text.
Below is the dataset. Column A lists dates, column B contains sales or “Closed,” and the labeled cell B17 will hold the daily sales standard deviation.
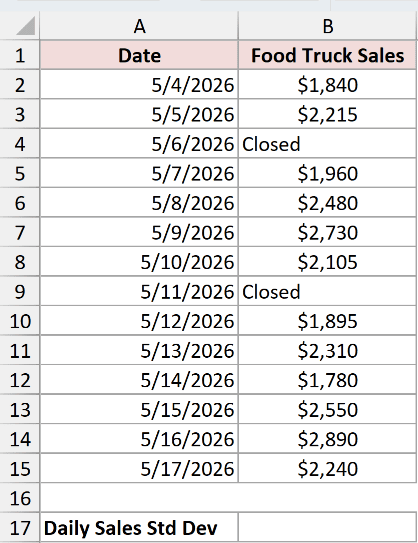
We want the sales spread across every day in this period, including days when the truck was closed.
Here is the formula for B17:
=STDEVPA(B2:B15)
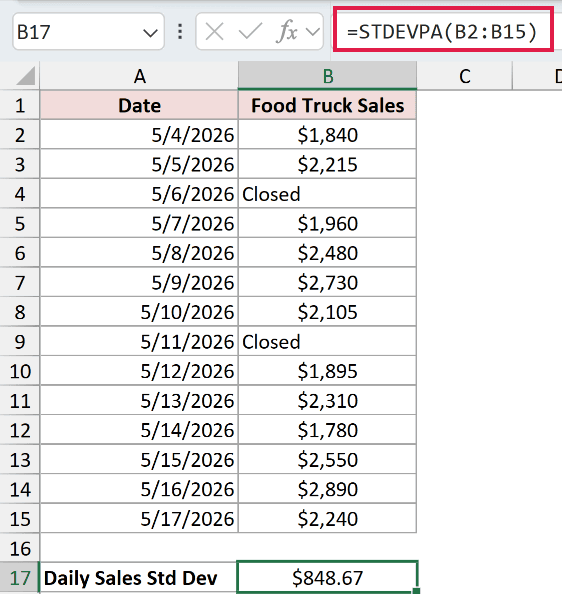
The result is $848.67. STDEVPA includes each “Closed” entry as zero sales, which matches what happened on those days.
The result describes variation in daily sales across the complete period. It uses dollars, the same units as the sales figures.
STDEVPA returns a single result from the entire range. It doesn’t spill separate answers down the sheet.
Pro Tip: A truly empty sales cell is skipped, while a text label counts as zero. Use “Closed” only when you know there were no sales.
Example 2: When Text Is Missing Information
Now let’s look at a case where counting text as zero gives a misleading result.
Below is the dataset. Column A lists branches, column B holds satisfaction scores or “Not reported,” and labeled cells below provide space for a comparison.
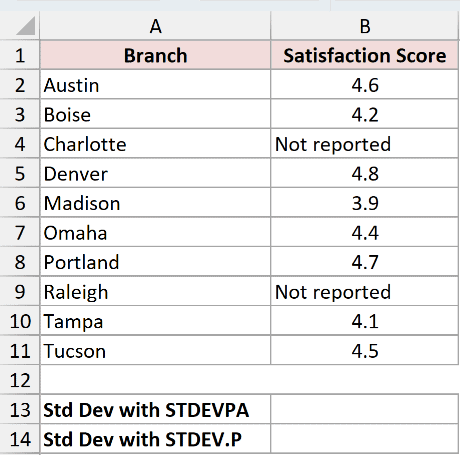
We want to compare the mistaken treatment of missing scores as zeros with a calculation using only reported scores.
Here is the STDEVPA formula in B13, demonstrating the mistake:
=STDEVPA(B2:B11)
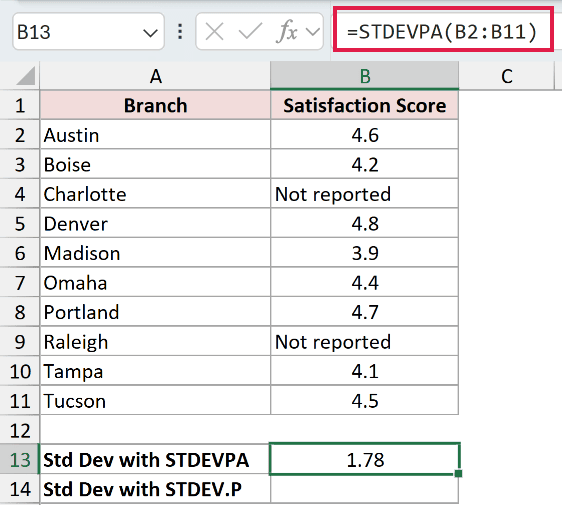
This misleading calculation returns 1.78. It treats “Not reported” as a zero score, although those branches haven’t supplied a score at all.
For comparison, STDEV.P calculates population standard deviation using only numbers in a reference. It skips the notes, which suits the reported scores here.
Enter this comparison formula in B14:
=STDEV.P(B2:B11)
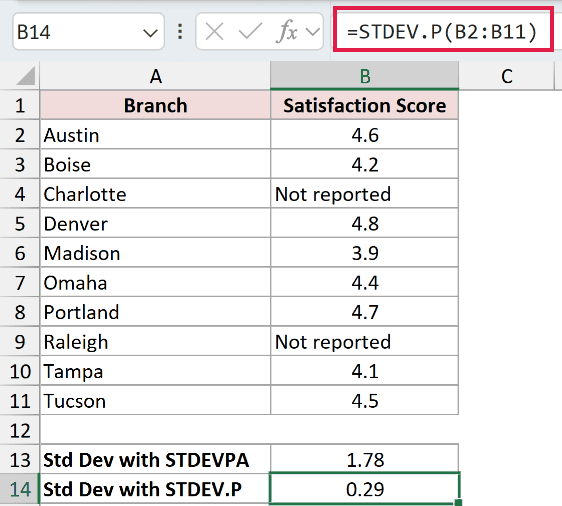
The comparison returns 0.29. That’s the spread of the reported scores, without introducing artificial zeros for the missing reports.
It still doesn’t describe every branch’s actual score. To report the complete branch population, you’ll need the missing scores first.
Example 3: Compare TRUE/FALSE Payment Records
STDEVPA can also measure variation in logical values stored in cells.
Below is the dataset. Column A lists months, columns B and C contain tenants’ on-time payment flags, and row 15 has labeled cells for comparing their standard deviations.
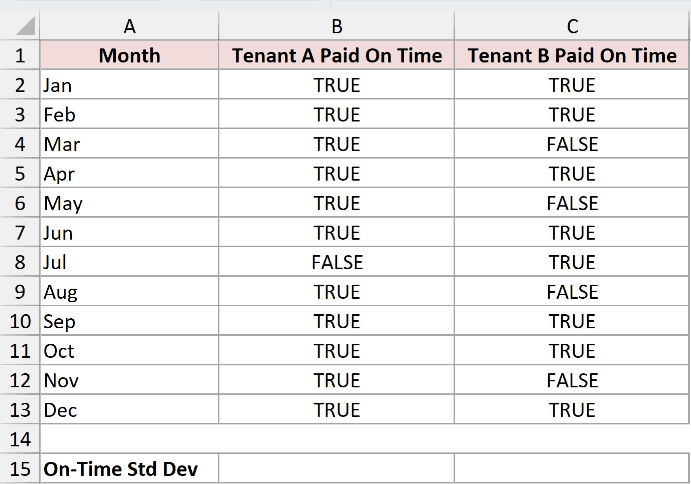
We want to compare variation in the tenants’ on-time payment records across the complete year.
Here is the formula for Tenant A in B15:
=STDEVPA(B2:B13)
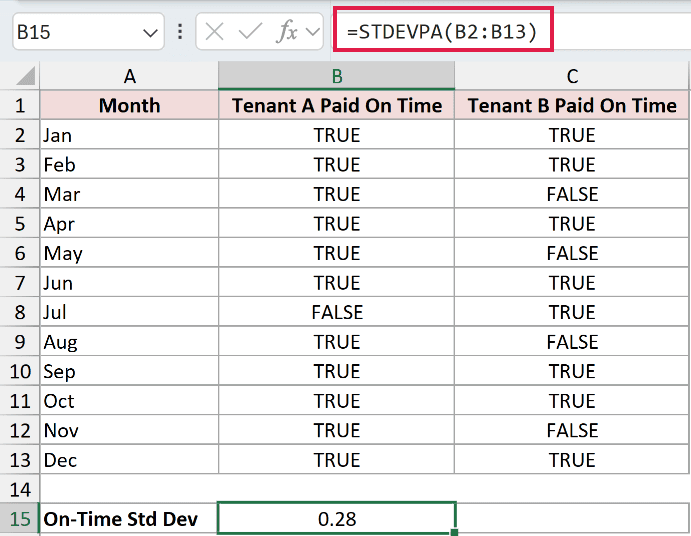
Tenant A’s result is 0.28. Excel counts each TRUE as 1 and each FALSE as 0, so every recorded month contributes.
For the side-by-side comparison, enter Tenant B’s formula in C15:
=STDEVPA(C2:C13)
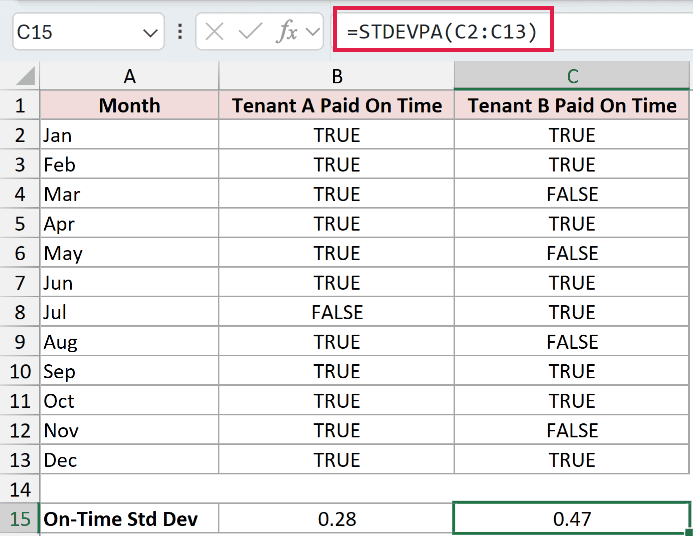
Tenant B’s comparison result is 0.47, showing more variation between on-time and late payments. Tenant A’s flags are more consistently TRUE in this dataset.
Pro Tip: A low standard deviation indicates consistent results. A tenant who is always late also has consistent flags. Read the TRUE/FALSE records alongside the comparison.
Example 4: Fix Numbers Stored as Text
Imported readings can look numeric while Excel stores them as text.
Below is the dataset. Column A lists units, column B contains meter readings, and the labeled cells below will compare the imported calculation with a corrected calculation.
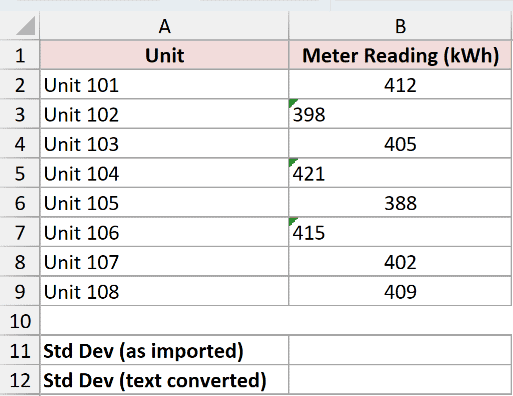
We want the population standard deviation of all the meter readings, with text numbers counted at their actual values.
First, this formula in B11 demonstrates the mistake of calculating directly from the mixed imported data:
=STDEVPA(B2:B9)
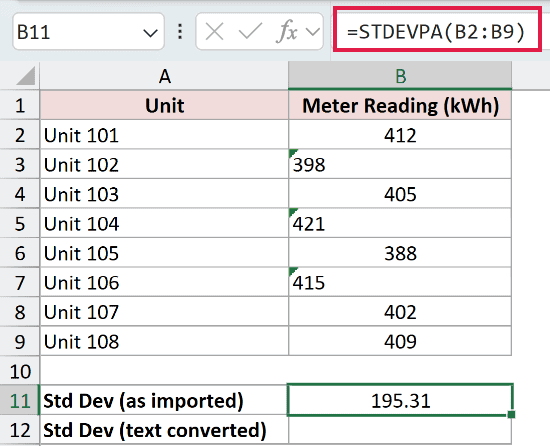
The misleading imported-data result is 195.31. Cells B3, B5, and B7 hold numbers as text, so STDEVPA counts them as zeros.
VALUE converts text that represents a number into a numeric value. Putting it inside STDEVPA lets the calculation use the actual readings.
This formula works as-is in Excel 2021, Excel 2024 and Microsoft 365; in Excel 2019 and earlier, confirm it with Ctrl+Shift+Enter.
=STDEVPA(VALUE(B2:B9))
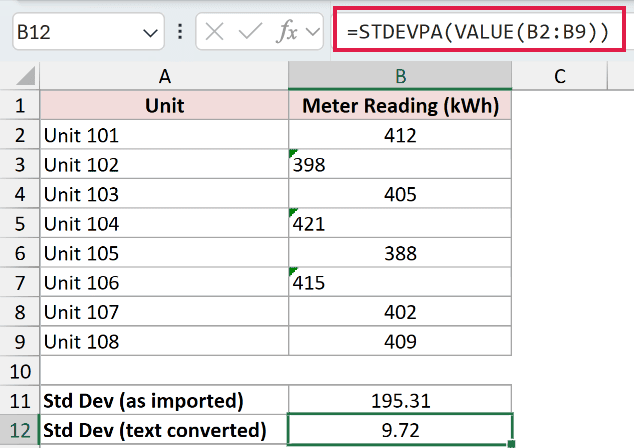
The corrected result is 9.72 kWh. The text storage problem caused the apparent large spread.
VALUE processes the range inside the formula, and STDEVPA reduces the resulting numeric array to a single answer. The source cells keep their original contents.
Tips & Common Mistakes
- Check what text means before using STDEVPA. A closed day can mean zero sales. A missing report doesn’t mean a zero measurement.
- Keep reference rules separate from direct arguments. Numeric text typed directly as an argument is converted to a number. Numeric text stored in a referenced cell counts as zero.
- Watch for direct text errors. Non-numeric text supplied directly as an argument returns
#VALUE!, rather than counting as zero as it does in a worksheet reference. - Blank-looking cells aren’t always empty. A formula returning an empty string contributes zero. A truly empty cell is skipped.
- Check empty datasets. In testing, an all-blank range returned
#DIV/0!. A single included value returned 0 because there was no spread to measure.
Before trusting the result, check that your range represents the complete group and that every text entry has the meaning you intended.
Other Excel articles you may also like:
