If you want to measure how far apart a set of numbers is from their average, the DEVSQ function gives you the sum of those squared deviations in a single cell.
It’s the building block behind variance and standard deviation in Excel, so understanding it makes both of those easier to read.
DEVSQ returns a single value, but it works seamlessly inside dynamic array formulas like =DEVSQ(FILTER(...)).
In this article, I’ll walk you through the DEVSQ function with four practical examples.
DEVSQ Function Syntax in Excel
The DEVSQ function takes one or more numeric arguments and returns the sum of their squared deviations from the average.
=DEVSQ(number1, [number2], ...)
- number1 – the first number, range, or array of numbers. Required.
- number2, … – additional numbers, ranges, or arrays. Optional. You can pass up to 255 arguments in total.
When to Use DEVSQ Function
DEVSQ shows up any time you need a raw measure of how much a set of numbers varies. A few common cases:
- Comparing how spread out two datasets are around their respective averages.
- Computing sample variance directly:
=DEVSQ(data)/(COUNT(data)-1)equalsVAR.S(data). - Calculating the residual sum of squares in basic regression and least-squares fits.
- Checking the total variability of a series without manually averaging and subtracting each value.
Example 1: Sum of Squared Deviations for Test Scores
Let’s start with the most common use of DEVSQ: feeding it a range of numbers and reading the result.
Below is a dataset of eight students in column A and their math test scores in column B. Column D is where the DEVSQ result will go.
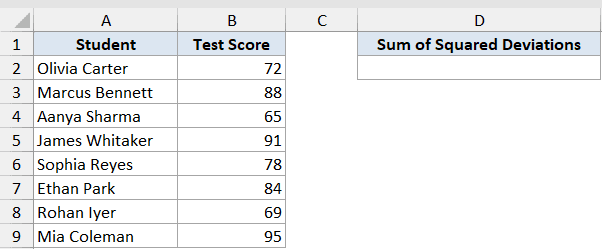
I want to compute the sum of squared deviations from the average score, in a single cell.
Here is the formula:
=DEVSQ(B2:B9)
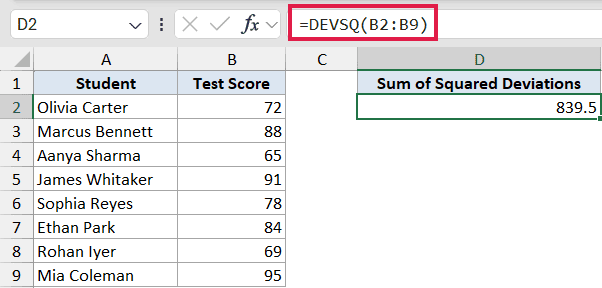
DEVSQ takes the eight scores, calculates their average, then sums up the squared difference between each score and that average.
The average score is 80.25, so DEVSQ adds up (72-80.25)², (88-80.25)², and so on, for all eight rows. The total comes to 839.5.
A bigger DEVSQ means the scores are more spread out. A smaller DEVSQ means they’re clustered closer to the average.
Pro Tip: DEVSQ doesn’t divide its result by anything, so the number grows fast as the dataset gets bigger or more varied. Divide by n-1 to get the sample variance (see Example 3).
Example 2: Rebuild DEVSQ Manually With SUMPRODUCT
Here’s a useful way to see what DEVSQ is actually doing under the hood.
Below is a dataset of seven days in column A and the daily sales in column B. We’ll compute DEVSQ in column D and rebuild the same value using SUMPRODUCT in column E.
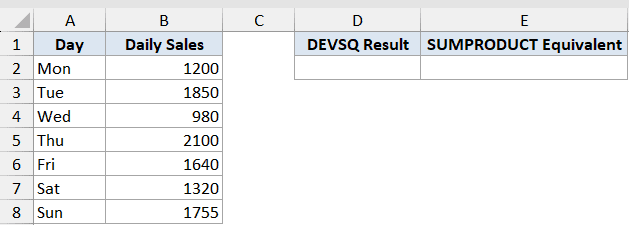
I want to compute the sum of squared deviations using DEVSQ, and verify the result by computing the same thing manually with SUMPRODUCT.
Here is the formula:
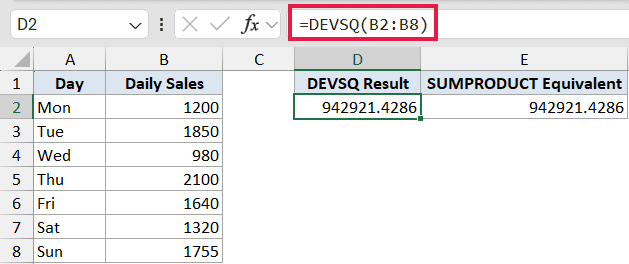
=DEVSQ(B2:B8)
How this formula works:
DEVSQ(B2:B8)returns 942921.43, the sum of squared deviations of the seven daily sales from the average.SUMPRODUCT((B2:B8-AVERAGE(B2:B8))^2)returns the exact same number. It subtracts the average from each value, squares the result, and sums those squares.
The two formulas are mathematically identical. DEVSQ just packages the whole operation into a single function call.
Pro Tip: Once you see that DEVSQ equals SUMPRODUCT((data-AVERAGE(data))^2), every formula that uses DEVSQ reads more naturally. You’re just summing squared distances from the mean.
Example 3: Derive Variance and Standard Deviation From DEVSQ
Now let’s use DEVSQ for what it’s really designed for: deriving variance and standard deviation.
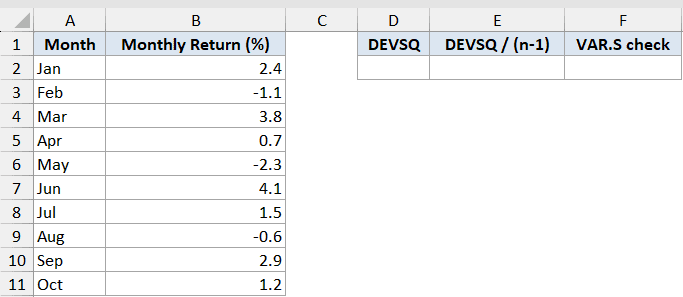
Below is a dataset of ten months in column A and the monthly return percentage in column B. Columns D, E, and F will hold DEVSQ, the derived variance, and a VAR.S check.
I want to confirm that dividing DEVSQ by (n-1) gives the same result as Excel’s VAR.S directly.
Here is the formula:
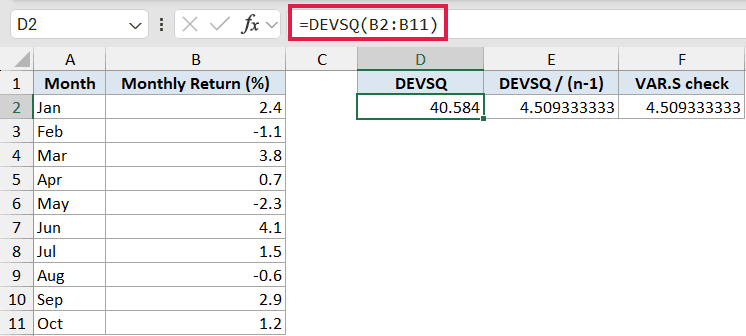
=DEVSQ(B2:B11)
How this formula works:
DEVSQ(B2:B11)returns 40.584, the sum of squared deviations of the ten monthly returns from their average.DEVSQ(B2:B11)/(COUNT(B2:B11)-1)returns 4.509. Dividing by (n-1) turns total squared variation into per-data-point sample variance.VAR.S(B2:B11)returns 4.509 as well, matching the manual calculation exactly.
Sample variance is literally DEVSQ / (n-1). Once you see that connection, both functions stop feeling like mysterious statistical boxes. DEVSQ is the raw spread, VAR.S is the same spread normalized.
Pro Tip: To get sample standard deviation from DEVSQ, take the square root of the variance: =SQRT(DEVSQ(B2:B11)/(COUNT(B2:B11)-1)). That equals STDEV.S(B2:B11) exactly. DEVSQ sits underneath both VAR.S and STDEV.S.
Example 4: Conditional DEVSQ With FILTER
For the final example, compose DEVSQ with FILTER to compute the spread within a specific subset of rows.
Below is a dataset of ten salespeople, with their region in column A, name in column B, and quarterly sales (in $K) in column C. Columns E and F will hold the DEVSQ result for each region.
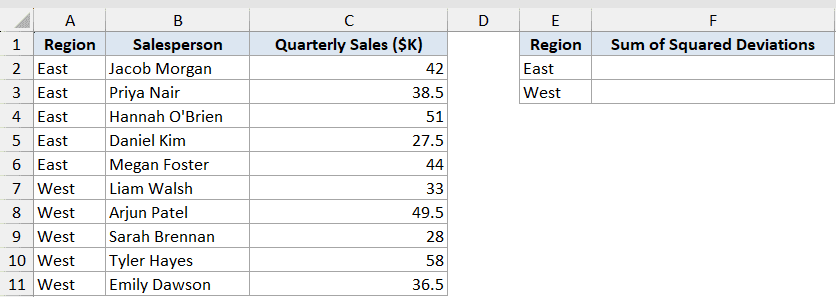
I want the sum of squared deviations within each region separately, without splitting the data into two ranges manually.
Here is the formula:
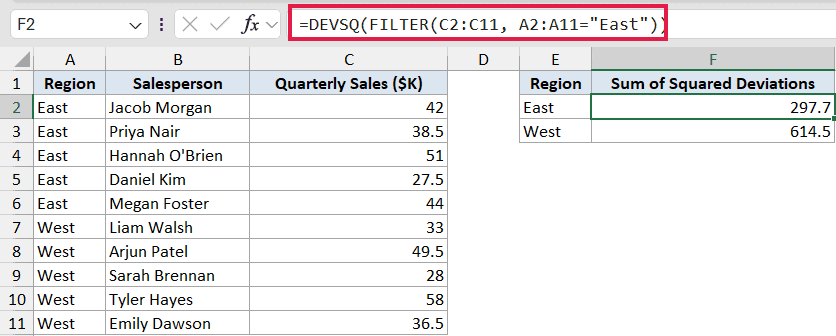
=DEVSQ(FILTER(C2:C11, A2:A11="East"))
How this formula works:
FILTER(C2:C11, A2:A11="East")returns just the sales values for the East region, a spilled array of five numbers.DEVSQ(...)reduces that filtered array to a single number: 297.7.
Swapping "East" for "West" in the same formula returns 614.5 for the West region. The West values are more spread out than the East values.
Before dynamic arrays, this kind of conditional statistic needed a helper column or a CSE array formula. With FILTER, you do it inline.
Pro Tip: This pattern works for any reducer. Try =AVERAGE(FILTER(...)), =SUM(FILTER(...)), or =COUNT(FILTER(...)) whenever you need a statistic on just the rows that meet a condition.
Tips & Common Mistakes
- DEVSQ ignores text and logical values inside ranges. If your data column has stray text like “N/A”, DEVSQ skips it without complaining.
- DEVSQ does not ignore zeros. A row with 0 still counts toward the average and the squared deviation, so leave missing data blank rather than typing 0.
- DEVSQ and SUMSQ look similar but do different things. SUMSQ squares the raw values; DEVSQ squares the deviations from the mean. Pick the right one for what you’re measuring.
- DEVSQ’s output grows fast because squaring amplifies large differences. A dataset with one outlier can dominate the result. Worth knowing when comparing DEVSQ across datasets.
- If every argument is non-numeric, DEVSQ returns a #NUM! error. That usually means the formula is pointing at the wrong column.
- DEVSQ doesn’t spill on its own (it’s a reducer). To get spread for multiple groups, compose it with FILTER as shown in Example 4.
DEVSQ is one of those quiet utility functions you rarely use directly but use constantly through other things, like variance, standard deviation, and regression residuals. Knowing what DEVSQ does makes those derived statistics feel a lot less mysterious.
Across these four examples, you’ve seen DEVSQ on a basic range, rebuilt by hand with SUMPRODUCT, used as the bridge to VAR.S, and composed with FILTER for conditional spread.
Related Excel Functions / Articles: