
Excel’s FORECAST.ETS.SEASONALITY function returns the length of the repeating pattern it detects in a time series.
The result counts timeline steps. A yearly pattern in monthly data returns 12, while a weekly pattern in daily data returns 7.
In this article, I’ll show you how to detect those patterns, interpret a zero result, use the detected season in a forecast, and check several series at once.
FORECAST.ETS.SEASONALITY Function Syntax in Excel
The function compares historical values with their timeline and returns the detected season length.
=FORECAST.ETS.SEASONALITY(values, timeline, [data_completion], [aggregation])
- values (required) is the range or array containing the historical values you want Excel to analyze.
- timeline (required) is the matching range or array of dates or numbers arranged at a consistent interval.
- data_completion (optional) controls missing points. Use 1, the default, to estimate them from neighboring points, or 0 to treat them as zero.
- aggregation (optional) controls how Excel combines values that share a timeline point. The default value of 0 uses AVERAGE.
When to Use FORECAST.ETS.SEASONALITY Function
- Check whether monthly sales repeat on a yearly cycle.
- Find weekly patterns in daily traffic, attendance, or order data.
- Confirm the season length Excel will use for an automatic FORECAST.ETS calculation.
- Distinguish a trend from a repeating seasonal pattern.
- Screen several related time series before building forecasts.
Example 1: Find a Yearly Sales Cycle
Let’s start with monthly sales that rise each spring and summer.
Below is the dataset. Columns A and B contain 36 months of dates and units sold. The green Season Length header and empty cell appear in column D.
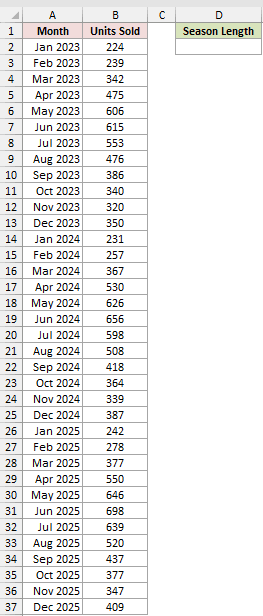
We want Excel to identify how many monthly observations make up the repeating sales cycle.
Here is the formula:
=FORECAST.ETS.SEASONALITY(B2:B37,A2:A37)
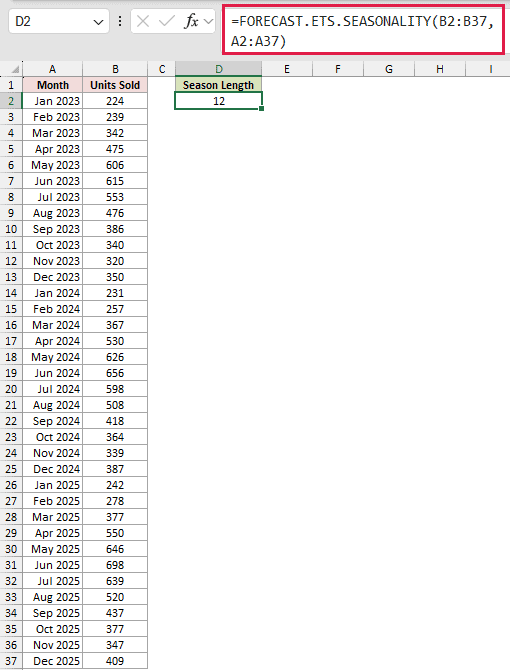
The formula returns 12. Because each timeline step is one month, the detected pattern repeats every 12 months.
Example 2: Detect a Weekly Check-In Pattern
Here’s the same idea with daily gym check-ins.
Below is the dataset. Columns A and B list 28 dates with weekday names and daily check-ins. Column D has the green Season Length header and an empty result cell.
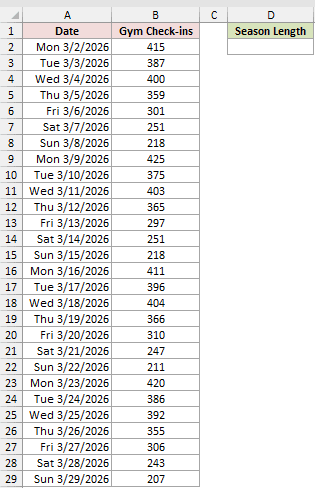
We want to find the number of daily observations in the repeating attendance pattern.
Here is the formula:
=FORECAST.ETS.SEASONALITY(B2:B29,A2:A29)
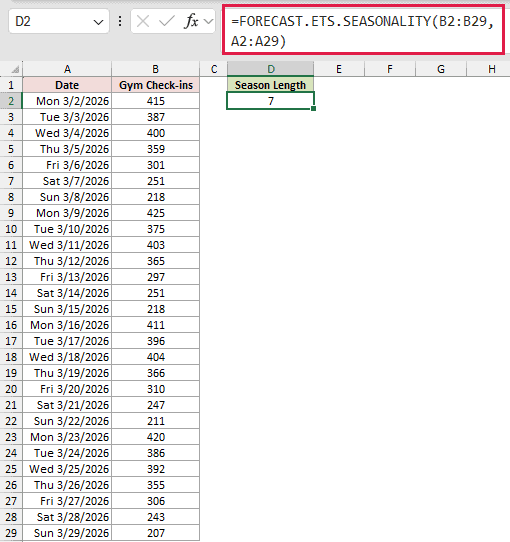
The result is 7. That means one week here because each row advances by one day.
Example 3: Identify Data With No Season
Now let’s check a series that grows without a regular cycle.
Below is the dataset. Columns A and B contain 24 months of app subscriber totals. Column D shows the green Season Length header and its empty result cell.
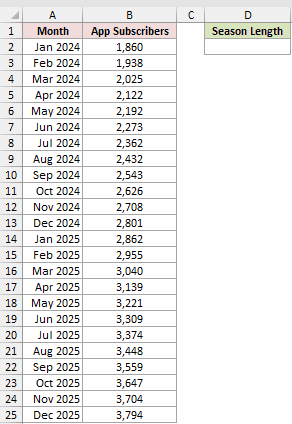
We want to check whether the upward movement also contains a repeating seasonal pattern.
Here is the formula:
=FORECAST.ETS.SEASONALITY(B2:B25,A2:A25)
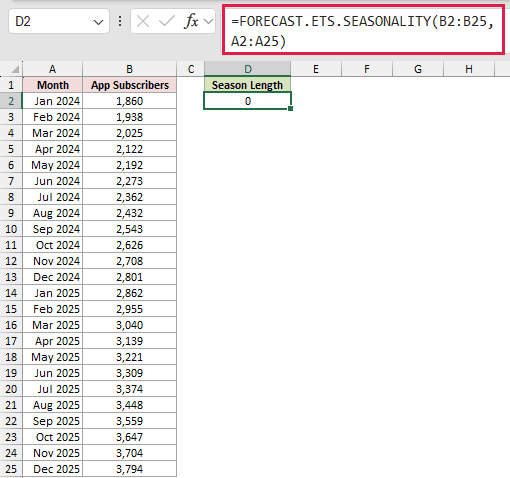
The formula returns 0. Excel found no repeating season in these subscriber totals.
The subscriber totals only climb. Seasonality needs a pattern that repeats at regular intervals.
Example 4: Understand Zero With Short History
A zero result can also appear when the visible pattern has too little history behind it.
Below is the dataset. Columns A and B contain one year of monthly garden-center sales. Column D has the green Season Length header and an empty result cell.
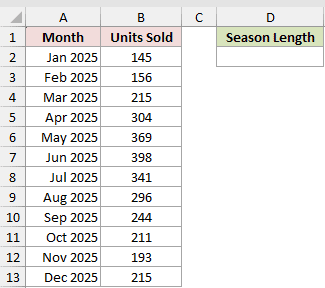
We want to see whether Excel detects a seasonal cycle from these 12 observations.
Here is the formula:
=FORECAST.ETS.SEASONALITY(B2:B13,A2:A13)
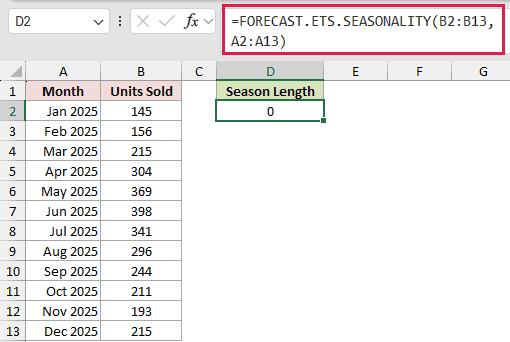
The formula returns 0 even though the monthly values appear seasonal. One cycle didn’t give Excel enough history to confirm the pattern in this dataset.
So a zero result needs context. It can mean no repeating pattern, or it can mean the series is too short for reliable detection.
Pro Tip: Compare the detected length with the business cycle you expect. If they disagree, inspect the history before relying on an automatic seasonal forecast.
Example 5: Use the Detected Season in FORECAST.ETS
Let’s use the detected length inside a FORECAST.ETS calculation.
Below is the dataset. Columns A and B contain 28 days of dinner guests, and F2:F8 contains seven future dates.
The green headers are Season Length, Forecast (Detected Season), and Forecast (No Season). Cells D2 and G2:H8 are empty.
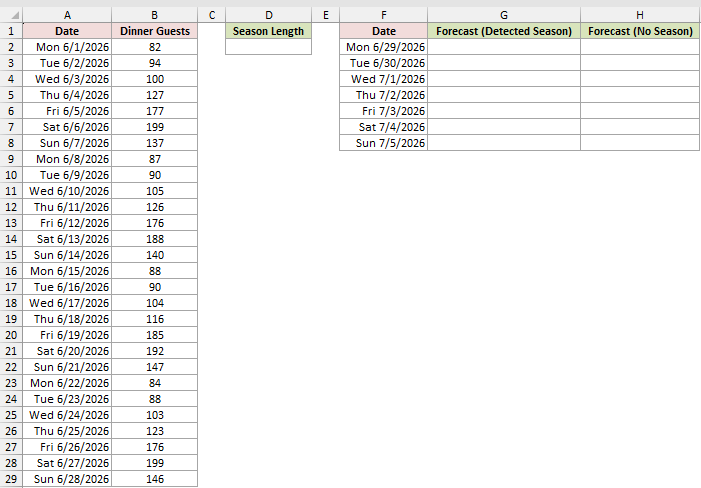
First, we want to detect the repeating pattern in the historical guest counts.
Here is the formula:
=FORECAST.ETS.SEASONALITY(B2:B29,A2:A29)
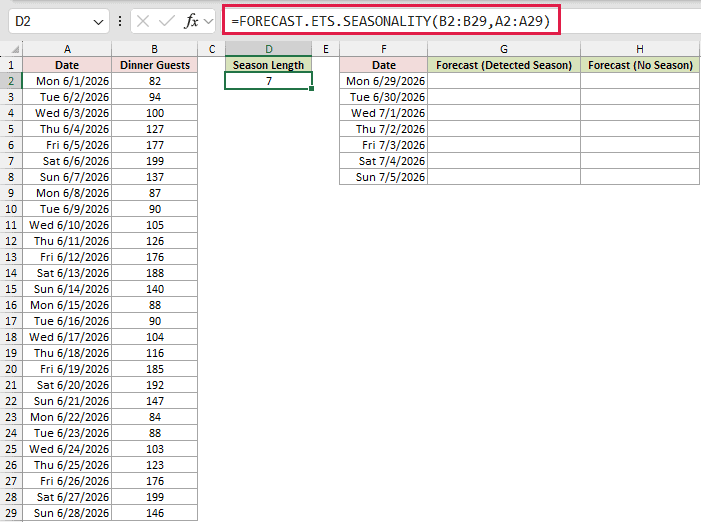
The result is 7, which matches a weekly pattern in the daily timeline.
Next, we want FORECAST.ETS to use that detected length for the seven future dates in F2:F8.
Here is the detected-season formula entered in G2:
=FORECAST.ETS(F2:F8,$B$2:$B$29,$A$2:$A$29,$D$2)
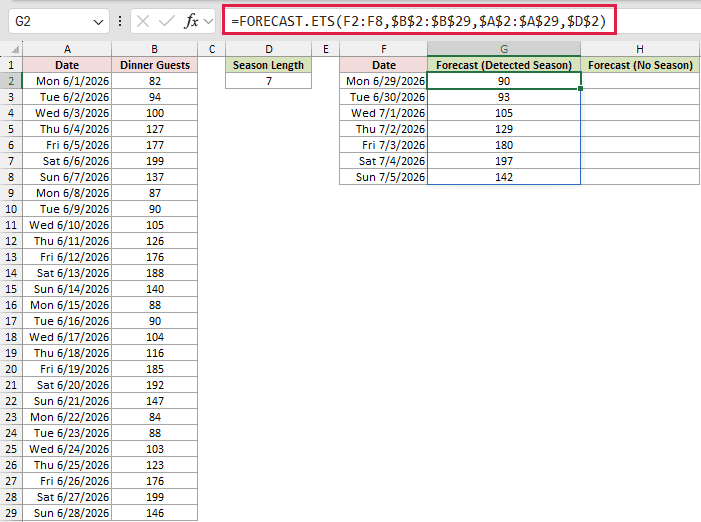
The formula references D2 as its seasonality argument and spills one forecast for each future date.
For comparison, we can tell FORECAST.ETS to ignore seasonality by using 0 as the final argument.
Here is the no-season formula entered in H2:
=FORECAST.ETS(F2:F8,$B$2:$B$29,$A$2:$A$29,0)
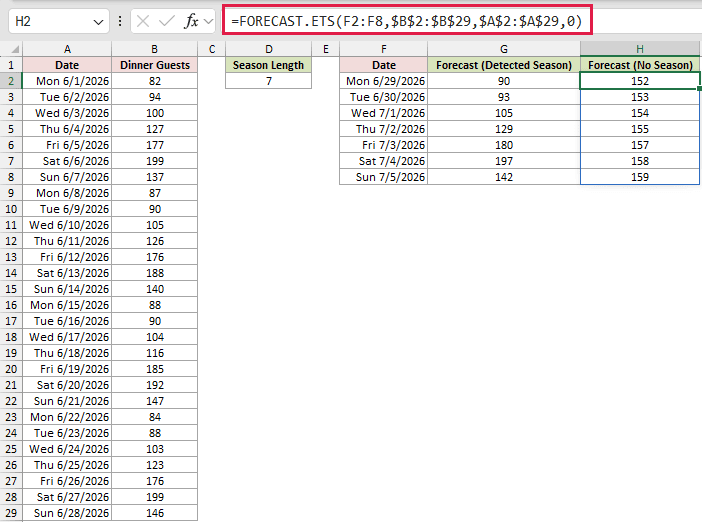
The detected-season forecast follows the weekly pattern. It starts at 90 on Monday, then peaks at 180 on Friday and 197 on Saturday.
The no-season forecast climbs steadily from 152 to 159, ignoring the weekday pattern.
These spilled FORECAST.ETS formulas require Excel 2021, Excel 2024, or Microsoft 365 on desktop.
Example 6: Check Several Series With BYCOL
The last example checks three product histories with one formula.
Below is the dataset. Column A contains 16 quarterly dates. The product headers are Snow Shovels, Garden Hoses, and LED Light Bulbs.
Row 19 has a Season Length label and three empty result cells.
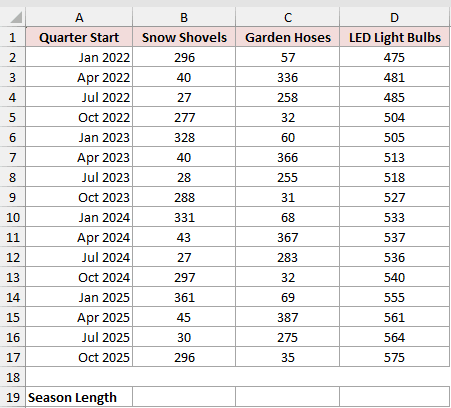
We want one detected season length for each product column.
Here is the formula entered in B19:
=BYCOL(B2:D17,LAMBDA(col,FORECAST.ETS.SEASONALITY(col,A2:A17)))
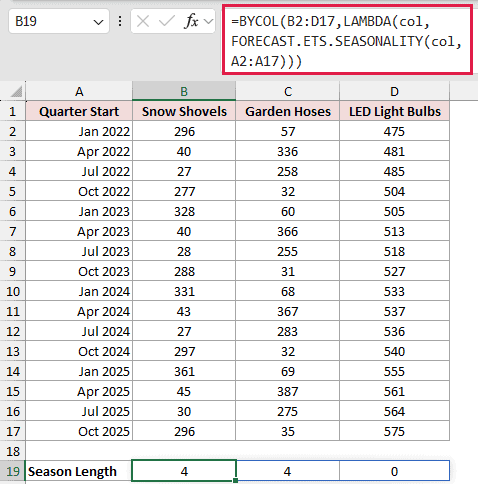
BYCOL passes each product column to the LAMBDA. FORECAST.ETS.SEASONALITY then returns one result for that column, and the three results spill across row 19.
The spilled results are 4, 4, and 0 for Snow Shovels, Garden Hoses, and LED Light Bulbs.
Both seasonal products repeat every four quarterly observations. LED Light Bulbs returns 0 because its sales grow steadily without a repeating season.
BYCOL and LAMBDA require Excel 2024 or Microsoft 365. In earlier desktop versions, enter a separate FORECAST.ETS.SEASONALITY formula for each product column.
Tips & Common Mistakes
- Excel can complete some missing timeline points, but a zero step isn’t allowed. It returns
#NUM!when it can’t find a constant step. - Excel returns
#N/Awhen the values and timeline ranges have different sizes. - A result of 0 doesn’t always prove there is no season. Check whether the history includes enough repeated cycles.
- Treat the returned number as timeline steps. Its calendar meaning depends on whether your rows are daily, monthly, quarterly, or another interval.
- Aggregation codes 1 through 7 are accepted. Code 8 returns
#NUM!. - Duplicate timeline dates returned 0 rather than an error. Check for duplicates before reading 0 as “no season,” because duplicate dates can also produce that result.
- FORECAST.ETS.SEASONALITY is available in Excel 2016 and later desktop versions, including Microsoft 365. It isn’t available in Excel for the web, iOS, or Android.
- Keep optional data-completion and aggregation settings consistent when comparing FORECAST.ETS.SEASONALITY with FORECAST.ETS, FORECAST.ETS.CONFINT, or FORECAST.ETS.STAT.
Compare the detected length with the cycle your business expects.
If they disagree, inspect the history and pass the known cycle to FORECAST.ETS.
Related Excel Functions / Articles:
