If you want to predict a future value from a trend in your existing data, the FORECAST function does it in one line.
You give it your known numbers and the point you care about, and it reads the answer off a straight trend line.
FORECAST returns a single prediction by default. But feed it a range of new x values in Excel 365 and the predictions spill into the cells below, so you can fill several future periods at once.
FORECAST Function Syntax in Excel
Here is how the function is put together:
=FORECAST(x, known_ys, known_xs)
- x (required) – the point you want a prediction for. Can be a single value or a range of values (a range makes the results spill).
- known_ys (required) – the values you already have for the thing being predicted (e.g. sales).
- known_xs (required) – the matching values for the driver (e.g. the month number). Must be the same size as known_ys.
FORECAST fits a straight (least-squares) trend line through your known points and reads the y off that line for the x you ask about.
When to Use FORECAST Function
- Predict the next period from a steady, ongoing trend (next month’s sales from the last ten months).
- Estimate a value that sits between two known points in your data.
- Project demand, cost, or headcount when the relationship is roughly linear.
- Fill several future periods at once instead of copying a formula down.
- Read a likely y value for any x, past or future, off the same fitted line.
Example 1: Predict next month’s sales
Let’s start with the most common case, predicting the next period from a clean trend.
Below is the dataset with the month number in column A and the matching sales in column B for ten months. To the right, cell D2 holds the month we want to predict (11) and E2 is where the forecast goes.
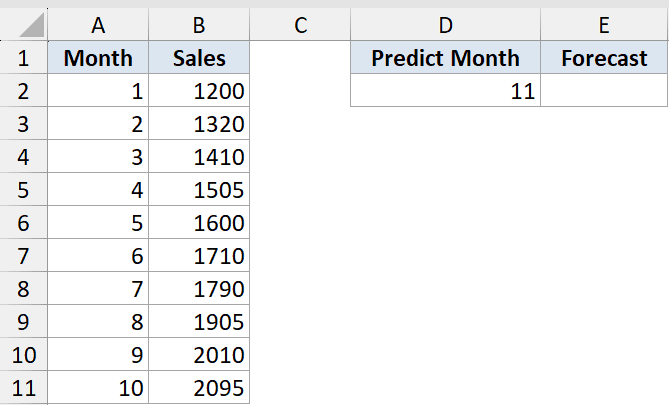
We want to predict sales for month 11 from the 10-month trend.
Here is the formula:
=FORECAST(D2,B2:B11,A2:A11)

FORECAST fits the best straight line through the 10 known months, then reads the sales value for month 11 off that line. The result is about 2,199.
D2 holds the month to predict (11), so you can change it without rewriting the formula.
FORECAST works, but on Excel 2016 and later use FORECAST.LINEAR for the same result with a clearer name. Type =FORECAST.LINEAR(D2,B2:B11,A2:A11) and you get the same 2,199.
Example 2: Estimate a value between known points
FORECAST is not only for predicting the future. It also fills in a value that sits between points you already have.
Below is the dataset with ad spend in column A and the revenue it brought in column B for eight past campaigns. Cell D2 holds an ad spend of 1,750, and E2 is where the estimate goes.
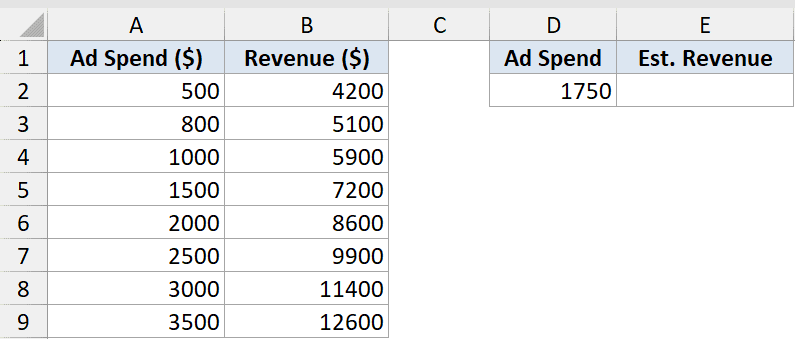
We want the expected revenue at an ad spend of 1,750, a value that is not in the data.
Here is the formula:
=FORECAST(D2,B2:B9,A2:A9)
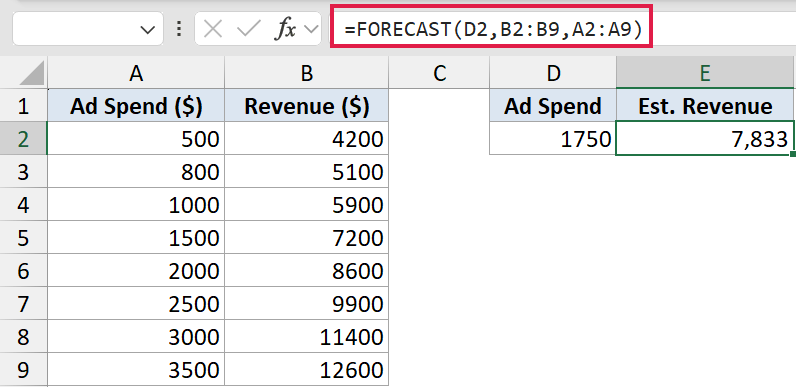
Here the line is fitted to spend versus revenue, and we read off the revenue for a spend of 1,750 that sits between two known points. The result is about 7,833.
Estimating inside the range of your data (interpolation) is the most reliable way to use FORECAST.
Example 3: Forecast several months at once
Now for the part that makes modern Excel nice. Instead of copying the formula down, you can forecast a whole stretch of months in one go.
Below is the same 10-month sales dataset in columns A and B. Column D lists the future months 11 through 14 in D2:D5, and column E is where the spilled forecasts land.
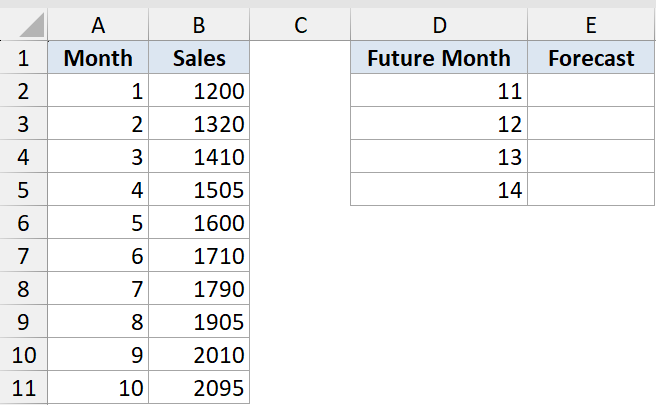
We want predictions for months 11 through 14 in one formula instead of copying it down.
Here is the formula:
=FORECAST(D2:D5,B2:B11,A2:A11)
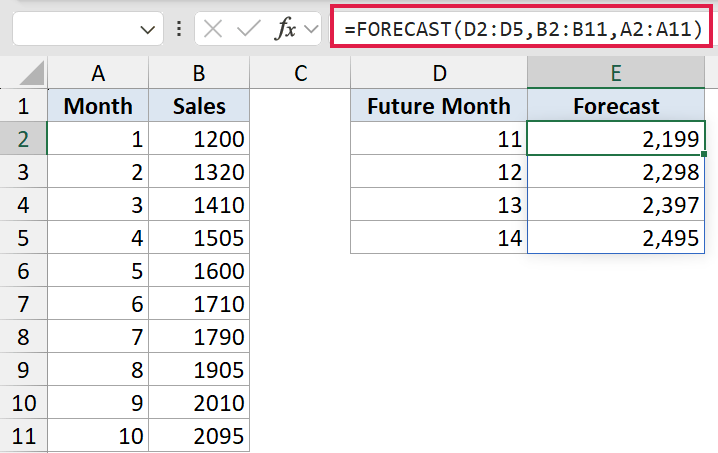
How this formula works:
- Passing the range D2:D5 as x returns one prediction per future month.
- The results spill down E2:E5 automatically, giving about 2,199 / 2,299 / 2,398 / 2,498.
- No copy-down and no array entry needed.
This needs Excel 365 or 2021. The same formula works with FORECAST.LINEAR.
Pro Tip: In older Excel without spill support, enter the formula across the four cells as an array with Ctrl+Shift+Enter, or just copy a single-cell FORECAST down the column.
Example 4: Project further into the future (with caution)
FORECAST does not stop you from reaching far ahead, so let’s see what happens when you push it.
Below is the same 10-month sales dataset in columns A and B. This time D2 holds month 24, well past the data, and E2 is where the forecast goes.
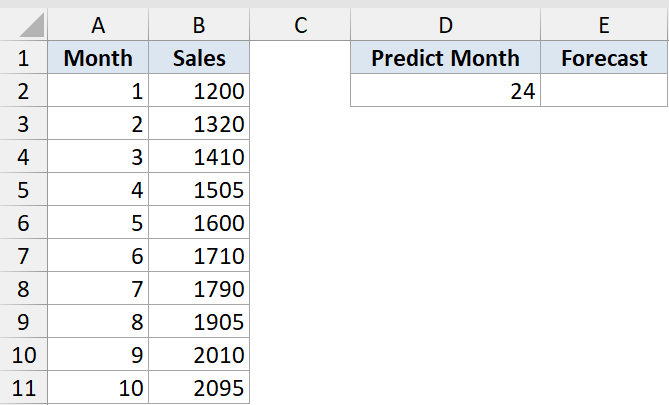
We want to project sales all the way out to month 24.
Here is the formula:
=FORECAST(D2,B2:B11,A2:A11)
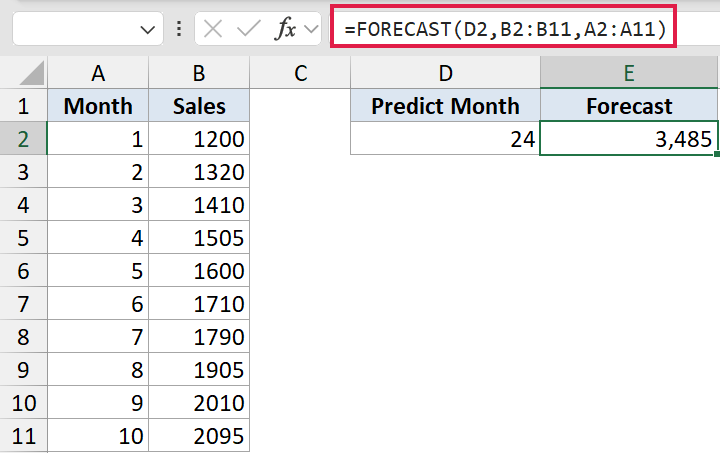
FORECAST will happily extend the straight line as far as you ask. Month 24 gives about 3,485.
But that assumes growth stays perfectly linear for another 14 months. The further past your data you go, the less you should trust the number.
Pro Tip: FORECAST always draws a straight line. If the real pattern curves or is seasonal (sales that spike every December), use FORECAST.ETS instead, which is built for seasonal time series.
Tips & Common Mistakes
- known_ys and known_xs must be the same size, or FORECAST returns #N/A. Selecting one extra row is the usual cause.
- If every known x is the same value (no spread), there is no line to fit and you get #DIV/0!.
- The x you predict for must be a number, or you get #VALUE!.
- FORECAST always assumes a straight line. Do not extrapolate wildly. Switch to FORECAST.ETS for seasonal data.
- FORECAST and FORECAST.LINEAR give the same result. FORECAST is the legacy name, so use FORECAST.LINEAR for new workbooks.
That is FORECAST from start to finish. Give it your known points and a value to predict, and it reads the answer off a fitted trend line.
It is great for steady trends and for filling gaps between known points. Just keep in mind it only draws straight lines, so reach for FORECAST.ETS when your data has seasonality.
Related Excel Functions / Articles: