In Excel, you can organize rows and columns in groups to easily hide and show different parts of the worksheet and create summary reports that show only the relevant details.
Below is an example of a dataset with rows and columns organized in groups.
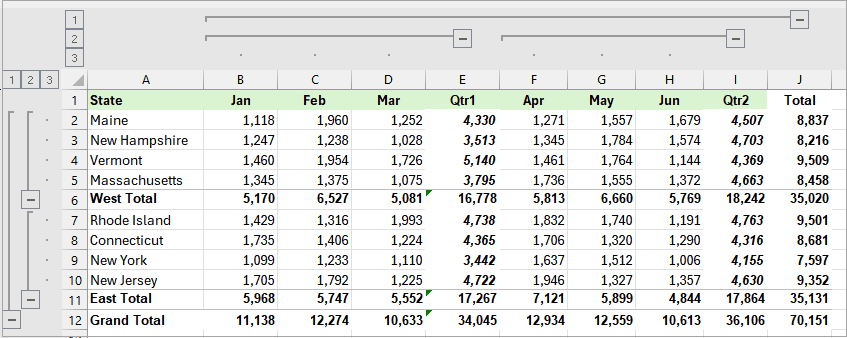
Note: Excel creates outlines for grouped rows and columns to help you easily navigate large datasets. Excel indicates the outline for the grouped columns by the outline symbols on top of the columns, and the outline symbols on the left side of the rows indicate the outline for the rows.
The grouping of rows and columns in Excel is especially helpful in preventing confusion when dealing with extensive worksheets.
You can remove the groupings when you no longer need them.
In this tutorial, I will show you ways to remove groupings in a normal range and a Pivot Table in Excel.
Note: Be careful before you remove the groupings in a normal range. You can’t make them reappear by clicking the Undo button; you must re-create them from scratch.
Remove Groupings in a Normal Range
To remove groupings in a normal range in Excel, use the Ungroup command, Clear Outline option, and VBA.
Method #1: Use Ungroup Command to Ungroup Particular Rows or Columns on a Worksheet
To ungroup particular rows or columns, use the Ungroup command on the Outline group of the Data tab.
Suppose you have the dataset below with grouped rows and want to ungroup rows 2:5.

Note: Notice the outline symbol on the left of rows 2:5.
Here’s how to do it:
- Click the row number header of row 2 and drag to select rows 2:5.

- On the Data tab, on the Outline group, open the Ungroup drop-down menu and click ‘Ungroup.’

Alternatively, you can use the shortcut SHIFT+ALT+Left Arrow.
As shown below, the above steps have ungrouped columns 2:5 and removed the outline symbol on the left of the rows.

Repeat the above steps for any other group you want to remove.
Note: To ungroup particular columns, select the columns and use step 2 above.
Also read: Group Rows or Columns (Shortcut)
Method #2: Use the Clear Outline Command to Ungroup All Rows and Columns on a Worksheet
To ungroup all rows and columns on a worksheet at once, use the Clear Outline command on the Outline group of the Data tab.
Suppose you have the dataset below with grouped rows and columns and want to remove all the groupings simultaneously.

Here’s how to do it:
- On the Data tab, on the Outline group, open the Ungroup drop-down menu and click the ‘Clear Outline’ option.

The above steps remove all the groupings from the dataset, as shown below:

Method #3: Use VBA to Ungroup All Rows and Columns in the Current Workbook
You can use the VBA code below to ungroup all rows and columns in the current workbook:
Sub RemoveAllGroupings()
Dim ws As Worksheet
For Each ws In ThisWorkbook.Worksheets
    ws.Activate
    Selection.ClearOutline
Next ws
End SubWhen you run the above code, it ungroups all rows and columns across all worksheets in the current workbook.
Hide the Outline Symbols
The outline symbols that Excel displays when you group data in a normal range can take up significant space on your screen depending on the number of levels.

If you want to see as much data as possible on your screen, you can temporarily turn off these symbols without removing the groupings by pressing CTRL + 8.

You can turn them back on by pressing CTRL + 8 again.
You can’t expand or collapse the outline when the outline symbols are hidden.
Remove Groupings in a Pivot Table
You can use the Ungroup command or the shortcut SHIFT + ALT + Left Arrow to remove groups in a Pivot Table.
Let’s say you have the Pivot Table below and want to remove the row and column groupings.

Note: The row items are grouped into East Region, West Region, and Central Region; the column items are grouped into Qtr1 and Qtr2.
Remove a Particular Group in a Pivot Table
To remove a particular group, let’s say, the East Region group, do the following:
- Select the group header, in this case, East Region.
- Right-click the selection and click the ‘Ungroup’ option on the shortcut menu.

Alternatively, use the shortcut SHIFT + ALT + Left Arrow.
The above steps remove the target group, as shown below.

Note: To remove a particular grouping of columns, select the group header and apply step 2 above.
Remove All Row or Column Groupings in a Pivot Table
Use the steps below to remove all row or column groupings from a Pivot Table:
- Click the plus sign (+) on the group header to expand the group. In this case, we expand the Qtr1 columns group.

- Right-click any item in the group and select ‘Ungroup’ on the shortcut menu.

Alternatively, use the shortcut SHIFT + ALT + Left Arrow.
The above steps remove all the column groups as shown below.

You can expand any row group and repeat steps 2 and 3 above to remove all the row groupings.

In this tutorial, I have shown you how to remove groupings in a normal range and Pivot Table in Excel. I hope you found the tutorial helpful.
Other Excel articles you may also like: