If you want to get the natural logarithm of a number in Excel, that is, the log to the base e (where e is roughly 2.71828), the LN function is what you’re looking for.
In Excel 365, you can also feed LN a range and the results will spill into the cells below.
In this article, I’ll walk you through how LN works with a few practical examples.
LN Function Syntax in Excel
Here is the syntax of the LN function:
=LN(number)
- number – The positive real number you want the natural logarithm of. LN returns a
#NUM!error if you pass zero or a negative number, and#VALUE!if the input is not numeric.
When to Use LN Function
Use this function when you need to:
- Convert a price series into log returns for finance or risk analysis.
- Calculate doubling time from a continuous growth rate using
LN(2)/r. - Calculate half-life from a decay rate using
LN(2)/k. - Linearize exponential data so you can fit a straight-line trend through it.
- Reverse an EXP calculation. LN and EXP are inverses, so
LN(EXP(x))is just x.
Let me show you a few practical examples of how to use this function.
Example 1: Natural Log of a Range of Numbers
Let’s start with a simple example.
Below is a small dataset with a list of positive numbers in column A. I want the natural logarithm of every value in one shot.
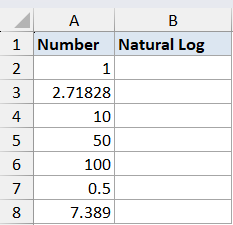
I want to compute the natural log of every number in the list using a single formula.
Here is the formula:
=LN(A2:A8)
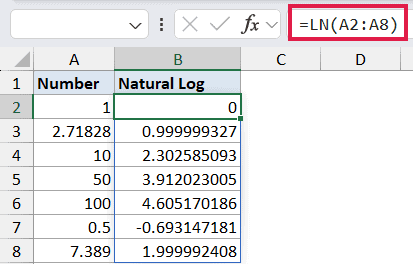
In the above formula, I’m passing the whole range A2:A8 to LN. Since LN spills in Excel 365, one formula in B2 fills all seven rows below it.
So LN(1) gives 0 (because e raised to the power 0 equals 1), LN(2.71828) gives roughly 1 (because that’s e), and LN(10) gives about 2.302585.
Pro Tip: If you’re on Excel 2019 or earlier, put =LN(A2) in B2 and drag it down. The spill behavior only works in Excel 365 and Excel for the web.
Example 2: LN and EXP as Inverses
Here’s a quick one that often clears up a lot of confusion about logarithms.
Below is a list of values in column A. I want to apply LN, then apply EXP to the result, and confirm I get the original number back.
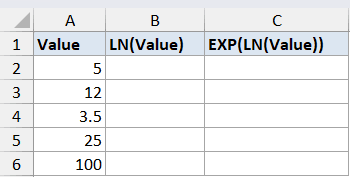
I want to round-trip each value through LN and then EXP to show they cancel out.
Here is the formula:
=EXP(LN(A2:A6))
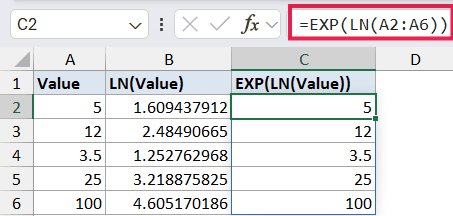
LN gives the power you’d have to raise e to in order to get the input. EXP does the reverse, raising e to that power. Wrap one inside the other and you’re back to where you started.
So 5 becomes about 1.6094 after LN, and then about 5 again after EXP. This is the basic identity behind log returns, antilogs, and just about every place LN shows up in real spreadsheets.
Example 3: Doubling Time from a Growth Rate
Now let’s look at something more practical.
Below is a list of continuous annual growth rates for different investments or savings accounts, expressed as decimals (so 0.05 means 5% per year). I want to know how many years it takes each one to double.
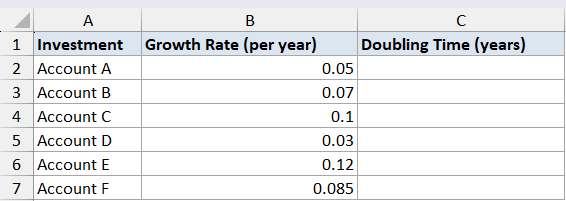
I want the doubling time in years for each growth rate in the list.
Here is the formula:
=LN(2)/B2:B7
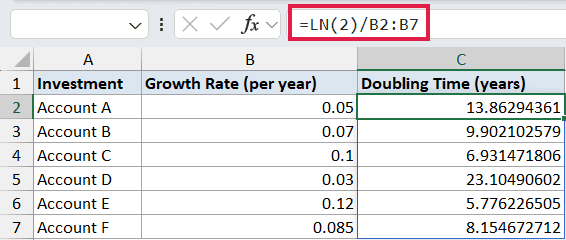
For continuous compounding, the time to double a value is LN(2) divided by the growth rate. LN(2) is roughly 0.6931, so a 5% continuous rate doubles in about 13.86 years, and a 10% rate doubles in about 6.93 years.
This is also where the famous “rule of 72” comes from. 72 divided by the percentage rate is a quick mental approximation of the same thing.
Example 4: Log Returns from a Price Series
Let’s step it up with something useful for anyone working with financial data.
Below is a list of closing prices for a stock over six consecutive trading days in column B. I want the daily log return between each pair of consecutive prices.
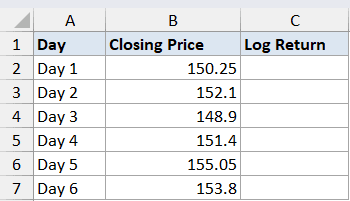
I want the daily log return for each day after the first using one spilled formula.
Here is the formula:
=LN(B3:B7/B2:B6)
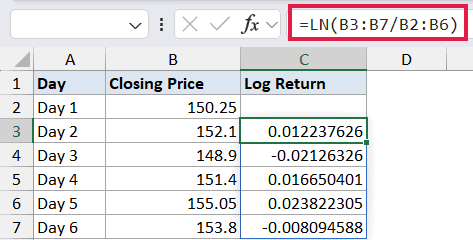
How this formula works:
B3:B7/B2:B6divides each day’s closing price by the previous day’s closing price. This gives the day-over-day price ratio.- LN of that ratio is the log return for the day.
Log returns are popular in finance because they add up cleanly over time. The log return over five days equals the sum of the five daily log returns, which is not true for plain percentage returns.
They’re also symmetric around zero, so a +5% log return and a -5% log return have the same magnitude.
Example 5: Linearize Exponential Data for a Trendline
Here’s another one I find genuinely useful when fitting curves.
Below is a dataset where column A has time (in months) and column B has the population of something growing exponentially (cells, customers, bacteria, whatever). I want to fit a straight line to it by linearizing with LN.
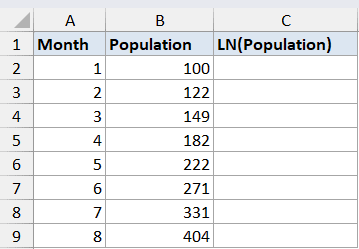
I want to convert each population value into its natural log so the relationship becomes a straight line in time.
Here is the formula:
=LN(B2:B9)
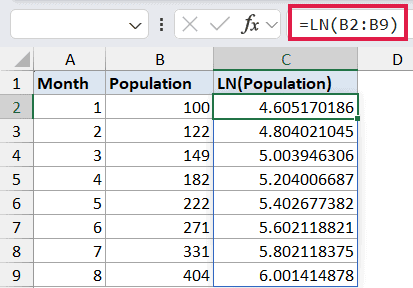
If the original data follows an exponential model like P = P0 * e^(r*t), taking the natural log of both sides gives LN(P) = LN(P0) + r*t. That’s the equation of a straight line in t, where the slope is the growth rate r and the intercept is LN(P0).
Once you have the log values, you can run SLOPE and INTERCEPT on them (or plot a chart with a linear trendline) and read the growth rate straight off the slope.
To get the original starting value back, just apply EXP to the intercept. The same idea is useful when you need to interpolate exponential data between known points.
Example 6: Half-Life from a Decay Rate
Here’s one more example along the same lines as doubling time, but going the other way.
Below is a list of radioactive isotopes (or any decaying quantity) and their continuous decay rates per year in column B. I want to find the half-life for each one.
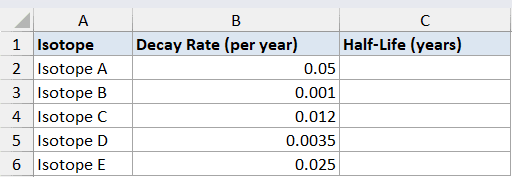
I want the half-life in years for each decay rate in the list.
Here is the formula:
=LN(2)/B2:B6
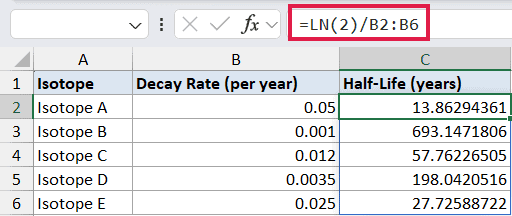
The half-life formula for continuous exponential decay is the same shape as the doubling time formula. LN(2) divided by the decay rate gives the time it takes for the quantity to drop to half its starting value.
So a decay rate of 0.05 per year gives a half-life of about 13.86 years, and a rate of 0.001 per year gives a half-life of about 693 years. The same math is what carbon dating and drug elimination times are built on.
Tips & Common Mistakes
- LN only accepts positive numbers. Passing zero or a negative value returns #NUM!, and passing text returns
#VALUE!. If your data has zeros or negatives, filter them out or add a small offset before applying LN. - Don’t confuse LN with LOG10 or LOG. LN is base e, LOG10 is base 10, and LOG lets you pick any base. So
LN(100)is about 4.605, butLOG10(100)is 2. - The inverse of LN is EXP, not 10^x. If you’ve taken the natural log of something and want to get back to the original number, use EXP. To go back from a log base 10 value, you’d raise 10 to that power instead.
- In Excel 2019 and earlier, you can’t pass a range to LN and get a spilled result. You’ll need a per-cell formula filled down. In Excel 365 and Excel for the web, the spill works natively.
- Watch out for
#SPILL!errors. If any cell in the spill range already has something in it, Excel can’t spill into it. Clear the blocking cells and the formula will work.
LN is the function I reach for whenever anything in a spreadsheet is growing or decaying continuously. Log returns, doubling time, half-lives, and curve fitting all use it.
Pair it with EXP when you need to go the other way, and that’s most of the natural-log work you’ll ever do in Excel.
Related Excel Functions / Articles: