If you want to measure how fast one variable changes relative to another, the SLOPE function is exactly what you need.
In this article, I’ll show you four practical examples of how to use SLOPE in Excel.
SLOPE returns a single number, but it works neatly inside dynamic array formulas, for example =SLOPE(FILTER(…),FILTER(…)).
SLOPE Function Syntax in Excel
The SLOPE function calculates the slope of a linear regression line through a set of data points.
=SLOPE(known_ys, known_xs)
- known_ys – the dependent values (the outcome you’re measuring, e.g. revenue or temperature)
- known_xs – the independent values (the driver, e.g. time or ad spend); must be the same length as known_ys
Errors to know:
#N/A– returned when the two arrays have different lengths#DIV/0!– returned when all x-values are identical (the slope is undefined)
When to Use SLOPE Function
- Measure the rate of change between two variables (e.g. sales over time)
- Build the slope component of a y = mx + b regression line
- Compare how steeply different groups or products are trending
- Feed the slope into a forecast or prediction formula
- Identify whether a trend is accelerating, declining, or flat
Example 1: Find the Slope of a Sales Trend
Let’s start with a simple scenario: you have monthly revenue data and want to know how fast sales are growing.
Below is the dataset with Month in column A (months 1-7) and Monthly Revenue in column B.
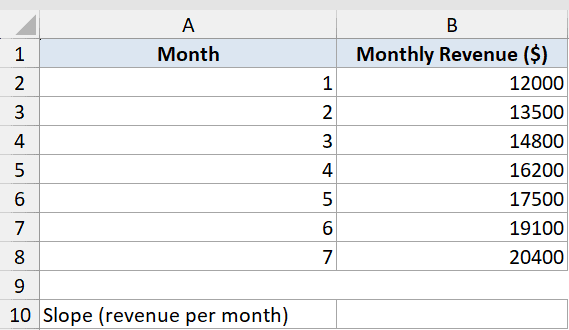
I want to find the slope of the revenue trend. Specifically, how many dollars of revenue are added per month on average.
Here is the formula:
=SLOPE(B2:B8,A2:A8)
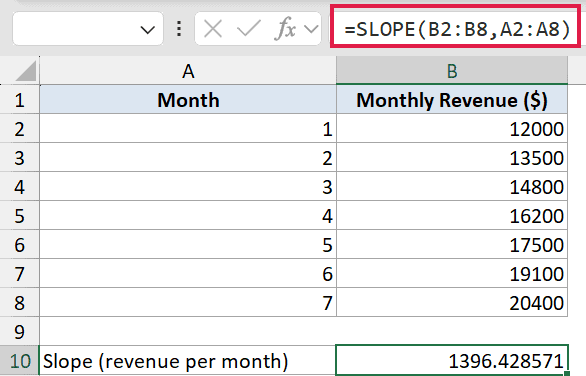
The result is 1396.43. Read it as: revenue grows about $1,396 per month on average.
A positive slope means the trend is going up. A negative slope would mean it’s declining.
Pro Tip: The slope is the “m” in the equation y = mx + b. It tells you the rate of change. To get the full regression line, pair SLOPE with the INTERCEPT function. Example 3 shows how.
Example 2: Read Slope as a Rate of Change
Here’s another practical use case: tracking temperature over unevenly spaced days.
Below is the dataset with Day in column A (days 1, 3, 5, 7, 10, 14, 18) and average temperature in column B.
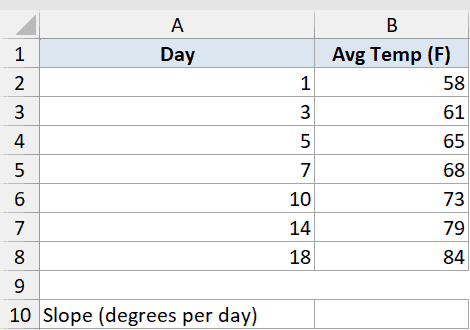
I want to find how many degrees the temperature rises per day on average across this stretch.
Here is the formula:
=SLOPE(B2:B8,A2:A8)
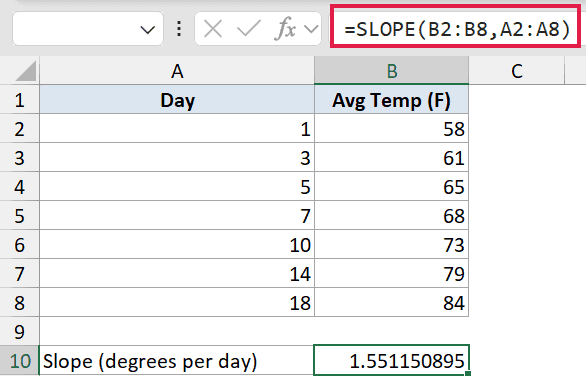
The result is about 1.55. That means temperature rises roughly 1.55 degrees per day.
One thing worth noting: the days here are unevenly spaced (1, 3, 5, 7, 10, 14, 18). SLOPE handles that just fine. It does a proper least-squares fit across all the points, not just a simple first-to-last calculation.
Example 3: Combine SLOPE and INTERCEPT to Predict
Let’s step it up. Once you have the slope and intercept, you can predict any value on the regression line.
Below is the dataset with Ad Spend in column A and Revenue in column B (7 data points). Columns D and E hold the calculated slope, intercept, and prediction.
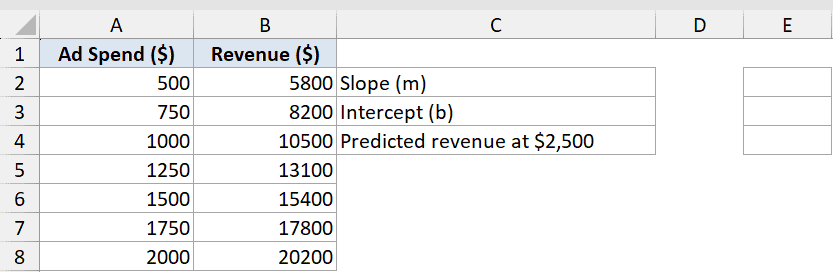
I want to calculate the slope, the intercept, and then use those to predict revenue at $2,500 ad spend.
Here are the formulas:
=SLOPE(B2:B8,A2:A8)
=INTERCEPT(B2:B8,A2:A8)
=E2*2500+E3
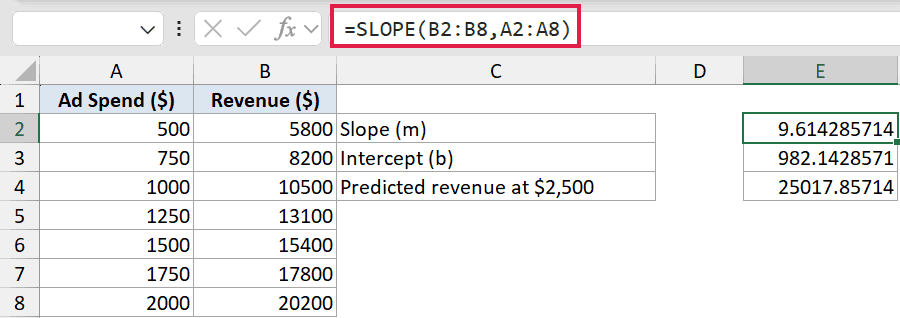
The slope (E2) comes out to 9.61, the intercept (E3) to 982.14, and the predicted revenue at $2,500 ad spend is $25,017.86.
How the prediction works:
The regression line formula is y = mx + b. Substituting in: y = 9.61 × 2500 + 982.14 = 25,017.86. To measure how well this line fits the data, you can also calculate the coefficient of determination (R²) in Excel.
E2holds the slope (m)E3holds the intercept (b)=E2*2500+E3plugs in 2500 as the x-value
If you only need the forecast and not the individual slope/intercept values, there’s a faster option in Excel 365. The FORECAST.LINEAR function gives you the same prediction in one step: =FORECAST.LINEAR(2500,B2:B8,A2:A8).
Example 4: Get the Slope for One Group With FILTER
Here’s where things get interesting. What if you have data for multiple reps and want the slope for each one separately?
Below is the dataset with Rep in column A, Quarter in column B, and Units Sold in column C. Alice and Bob each have 4 quarters of data.
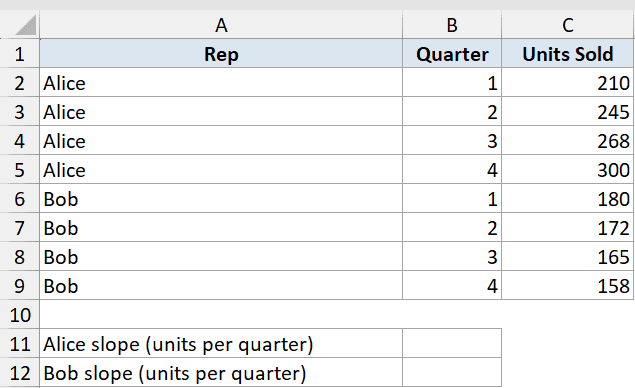
I want to calculate the sales slope (units per quarter) for Alice and Bob independently, without creating helper columns.
Here is the formula for Alice:
=SLOPE(FILTER(C2:C9,A2:A9="Alice"),FILTER(B2:B9,A2:A9="Alice"))
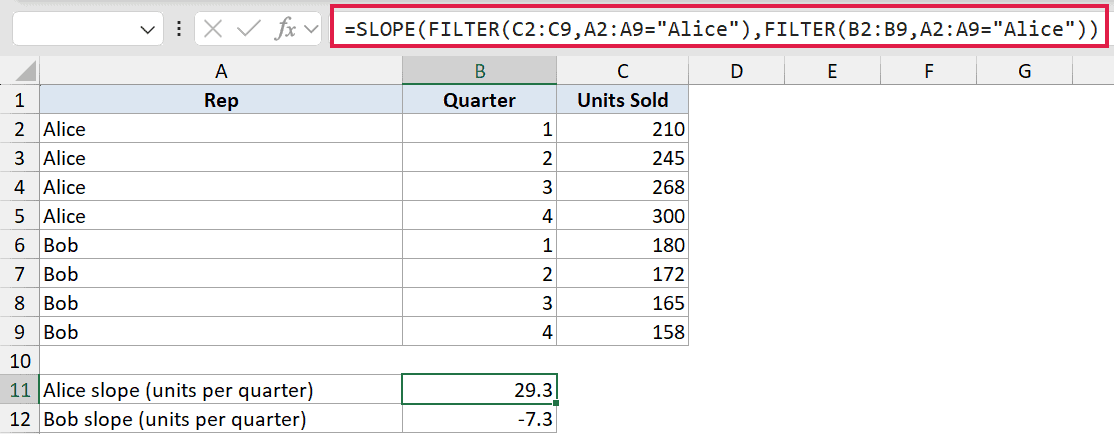
Alice’s slope is 29.3, meaning she adds about 29 units per quarter. The Bob equivalent (A2:A9="Bob") gives about -7.3, meaning his sales are declining.
How this formula works:
FILTER(C2:C9,A2:A9="Alice")extracts just Alice’s Units Sold valuesFILTER(B2:B9,A2:A9="Alice")extracts her corresponding Quarter numbers- SLOPE then runs on just those filtered rows
This is the dynamic-array showcase for SLOPE: wrapping it in FILTER lets you get a group’s slope on the fly, with no helper columns needed.
Pro Tip: Both FILTER arrays must return the same number of rows, or SLOPE will return #N/A. Also note that this requires Excel 365. The FILTER function isn’t available in older Excel versions.
Tips & Common Mistakes
- Both arrays must be the same length. If known_ys and known_xs have different numbers of cells, SLOPE returns #N/A. Double-check that your two ranges cover exactly the same number of rows (or columns).
- Identical x-values cause #DIV/0!. If all your x-values are the same number (e.g. all 1s), the slope is mathematically undefined and SLOPE will return an error. Make sure the x-values actually vary.
- Text and blank cells are ignored. SLOPE skips any pair where either value is text or blank. This can silently shrink your dataset, so check for gaps before relying on the result.
- Pair with INTERCEPT for the full picture. SLOPE alone gives you the rate of change, but not where the line starts. Use INTERCEPT alongside SLOPE to build the complete y = mx + b regression line.
- Use FORECAST.LINEAR for one-step predictions. If you only need to predict a value at a specific x,
=FORECAST.LINEAR(x,known_ys,known_xs)does the slope+intercept math internally and skips the separate cell references.
In this article, you saw how SLOPE measures the rate of change across a range of data points. It works on evenly or unevenly spaced data, handles negative trends just as well as positive ones, and composes naturally with FILTER for per-group analysis. If you need to measure the strength of the relationship between your variables (not just the direction), the correlation coefficient is the next thing to look at.
Related Excel Functions / Articles: