
The DURATION function in Excel returns a bond’s Macaulay duration in years from its settlement date, maturity date, coupon rate, yield, and payment frequency.
This measures the weighted average time to receive the bond’s cash flows. It differs from maturity, which tells you when the final repayment is due.
Duration helps compare bonds with different payment patterns. For an estimate of price sensitivity to yield changes, the related measure is modified duration.
In this article, I’ll show you how to compare bond durations, examine coupon and term effects, and estimate price changes using modified duration.
DURATION Function Syntax in Excel
DURATION uses the bond’s dates, annual rates, and payment schedule:
=DURATION(settlement, maturity, coupon, yld, frequency, [basis])
- settlement (required): The date the bond is traded to the buyer. Use a real Excel date.
- maturity (required): The date the bond expires and repays its principal.
- coupon (required): The annual coupon rate, entered as a percentage.
- yld (required): The annual yield, also entered as a percentage.
- frequency (required): Coupon payments per year. Use
1for annual,2for semiannual, or4for quarterly. - basis (optional): The day-count convention.
0or omitted means US (NASD) 30/360;1means actual/actual;2means actual/360;3means actual/365;4means European 30/360.
The result is Macaulay duration, measured in years. It averages the time until each payment, weighting those payments by their present values.
The calculation assumes $100 par value, but the result isn’t a dollar amount. Owning more or less of the same bond doesn’t change its duration.
When to Use DURATION Function
- Calculate Macaulay duration for a bond with regular coupon payments.
- Compare the timing of cash flows across a bond watchlist.
- Test how changing the coupon rate affects duration while other inputs stay fixed.
- Compare maturity dates and payment frequencies using the same coupon and yield.
- Calculate Macaulay duration before comparing it with MDURATION for a price-sensitivity estimate.
Example 1: Calculate a Corporate Bond’s Macaulay Duration
Let’s start with one bond and a small input card.
Below is the dataset. Cells A1:B6 contain settlement, maturity, annual coupon rate, annual yield, coupon frequency, and day-count basis.
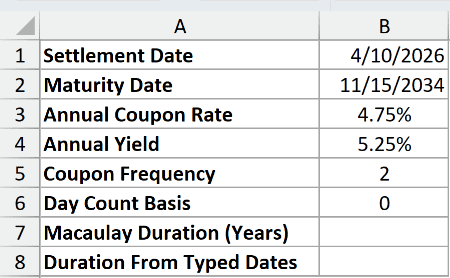
We want to calculate this bond’s Macaulay duration in years.
Here is the formula for B7:
=DURATION(B1,B2,B3,B4,B5,B6)
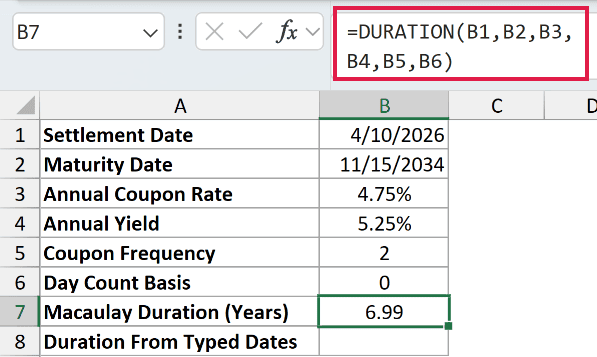
The formula returns 6.99 years. It uses settlement on 4/10/2026, maturity on 11/15/2034, a 4.75% coupon, and a 5.25% yield.
The frequency of 2 means two coupon payments each year. Both rates remain annual rates; you don’t divide them before passing them to DURATION.
The duration falls before maturity because the bond pays coupons along the way. Those earlier payments pull the weighted average payment time forward.
You can also construct the dates directly with DATE. Here is the formula for B8:
=DURATION(DATE(2026,4,10),DATE(2034,11,15),B3,B4,B5,B6)
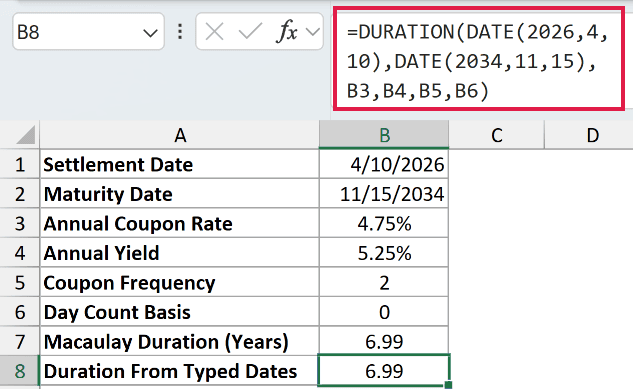
This also returns 6.99. DATE creates the same numeric dates stored in B1 and B2, without relying on Excel to interpret quoted date text.
If yield is the unknown, calculate it with YIELD first. PRICE handles the different job of calculating a bond’s price from its yield.
Pro Tip: Format the duration result as a number, such as 0.00. It represents years, so a date, currency, or percentage format would mislabel the answer.
Example 2: Compare Duration Across a Bond Watchlist
Now let’s apply the calculation to several bonds.
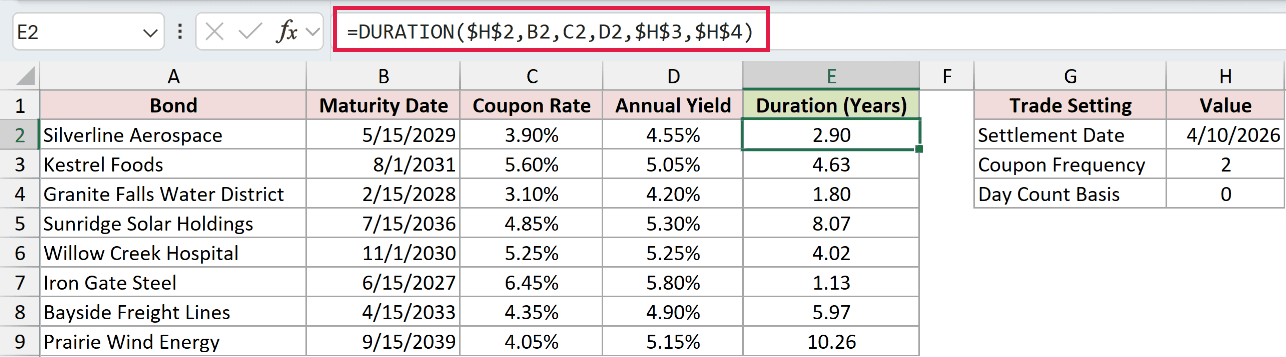
Below is the dataset. Columns A:D list eight bonds, maturity dates, coupons, and yields. The card in G1:H4 holds the shared trade settings.
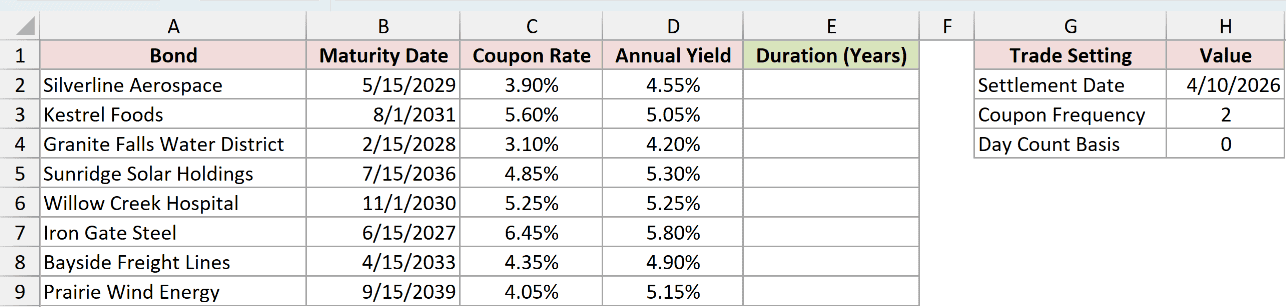
We want each bond’s duration using the same settlement date, payment frequency, and day-count basis.
Here is the formula for E2, which you then copy down through E9:
=DURATION($H$2,B2,C2,D2,$H$3,$H$4)
How this formula works:
$H$2keeps settlement fixed at4/10/2026.B2,C2, andD2supply that row’s maturity, coupon, and yield. These references move as you copy down.$H$3and$H$4keep frequency and basis fixed for every bond.
Silverline Aerospace returns 2.90 years, while Kestrel Foods returns 4.63 years. Each row has its own formula because DURATION rejects range arguments.
Iron Gate Steel has the shortest duration here at 1.13 years. Prairie Wind Energy has the longest at 10.26 years.
Maturity, coupon, and yield all vary across this watchlist. To see what changing the coupon alone does, we need to hold the other inputs still.
Example 3: See How Higher Coupons Shorten Duration
Let’s isolate the coupon rate so the comparison is easier to read.
Below is the dataset. A2:A8 lists seven coupon rates from 0.00% to 8.00%. The card in D1:E6 holds the remaining bond inputs.
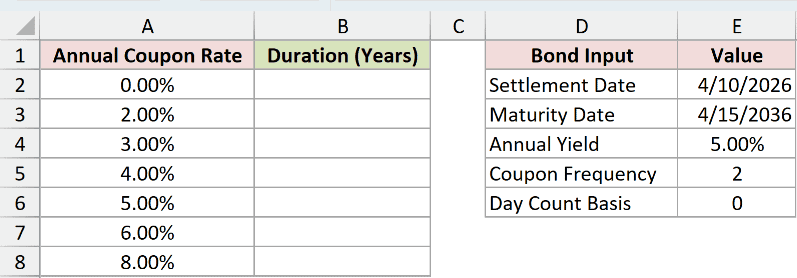
We want to measure how duration changes as the coupon rises while yield and dates stay fixed.
Here is the formula for B2, copied down through B8:
=DURATION($E$2,$E$3,A2,$E$4,$E$5,$E$6)
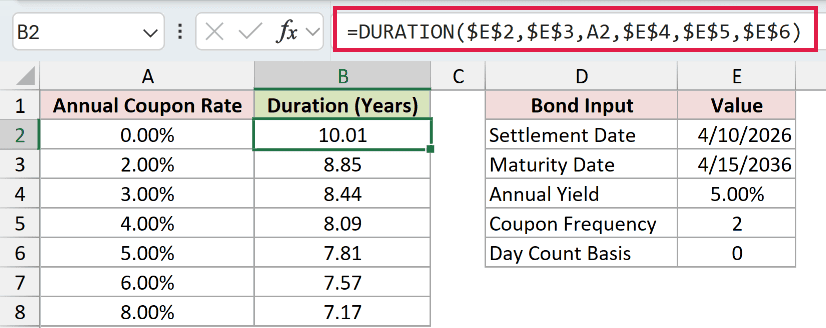
Only A2 changes as the formula moves down. The absolute references keep the annual yield at 5.00%, with settlement and maturity unchanged.
At a 0.00% coupon, duration is 10.01 years. With no coupon payments, all the cash arrives at maturity, so duration equals the remaining term.
That result isn’t exactly ten years because settlement is 4/10/2026 and maturity is 4/15/2036. The dates are slightly more than ten years apart.
The 2.00% coupon produces 8.85 years, the 5.00% coupon produces 7.81 years, and the 8.00% coupon produces 7.17 years.
Larger coupons bring more cash forward. That reduces the weighted average payment time even though the maturity date never changes.
Example 4: Compare Payment Frequency and Bond Term
Next, let’s compare two maturity dates under three payment schedules.
Below is the dataset. Columns A:C list six scenarios, maturity dates, and frequencies. The card in F1:G5 holds settlement, coupon, yield, and basis.
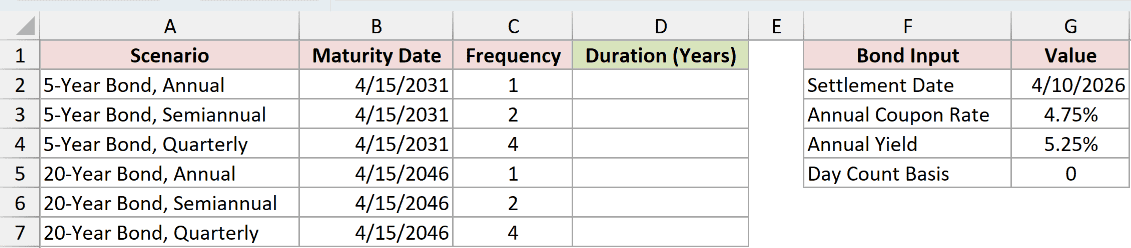
We want to compare how payment frequency and the remaining term affect duration.
Here is the formula for D2, copied down through D7:
=DURATION($G$2,B2,$G$3,$G$4,C2,$G$5)
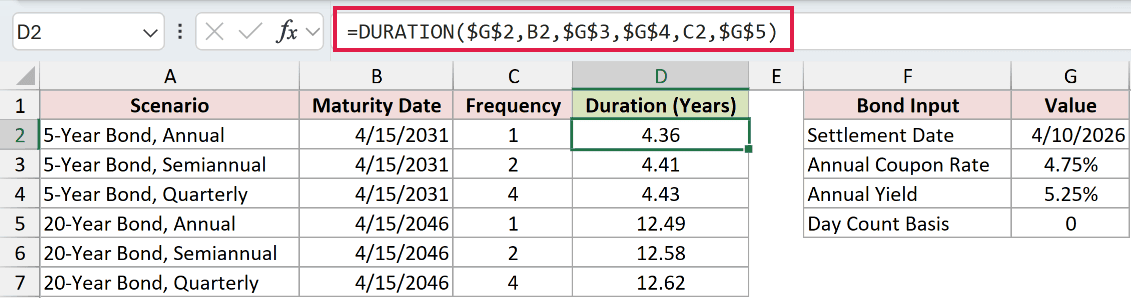
B2 supplies each scenario’s maturity, and C2 supplies its frequency. The shared annual coupon and yield stay at 4.75% and 5.25%.
For the five-year scenarios, duration is 4.36 years with annual payments, 4.41 years with semiannual payments, and 4.43 years with quarterly payments.
For the twenty-year scenarios, the corresponding results are 12.49, 12.58, and 12.62 years.
In this setup, frequency changes the result modestly. Moving to the later maturity has a much larger effect.
Settlement timing matters too. In these scenarios, settlement is shortly before a coupon date.
The comparison applies to this payment schedule. It doesn’t establish a general rule about how frequency affects duration.
Example 5: Estimate a Price Change With MDURATION
Finally, let’s turn duration into an estimate of how a yield increase could affect price.
Below is the dataset. A1:B6 holds the bond inputs, and A7:B7 holds a typed yield increase of 1.00% to test.
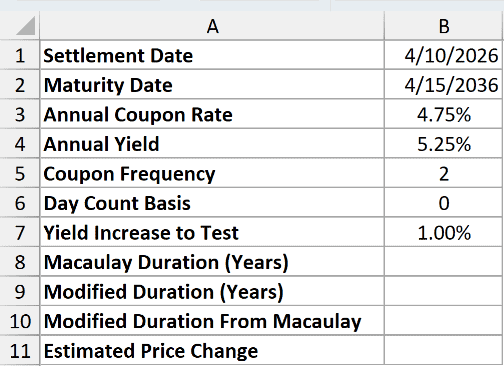
We want to calculate both duration measures and estimate the percentage price change for a one-percentage-point yield increase.
Here is the DURATION formula for B8:
=DURATION(B1,B2,B3,B4,B5,B6)
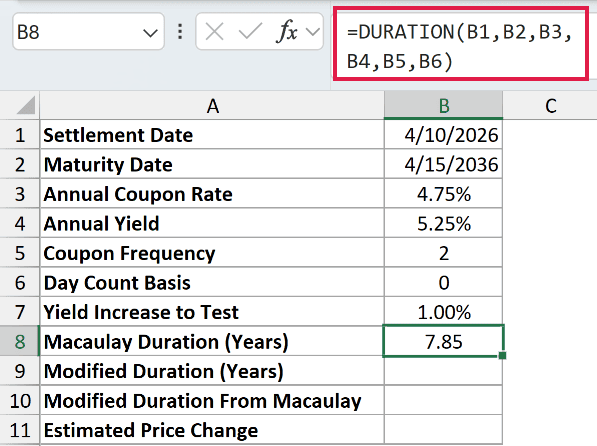
This returns 7.85 years of Macaulay duration. For the price estimate, we need modified duration, which adjusts that result for yield and payment frequency.
Here is the MDURATION formula for B9:
=MDURATION(B1,B2,B3,B4,B5,B6)
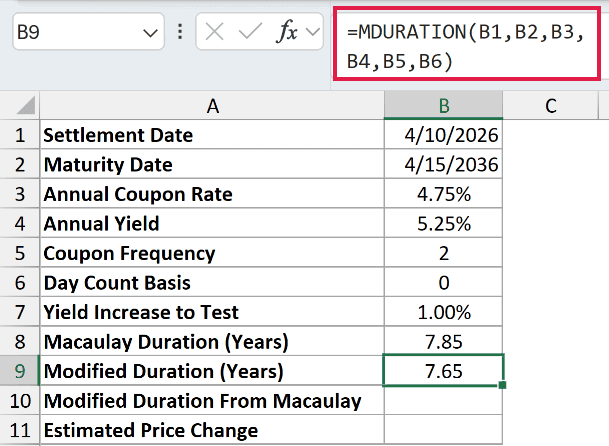
MDURATION takes the same six arguments and returns 7.65. It’s the more direct function when your goal is a price-sensitivity estimate.
To see the relationship between the two measures, enter this formula in B10:
=B8/(1+B4/B5)
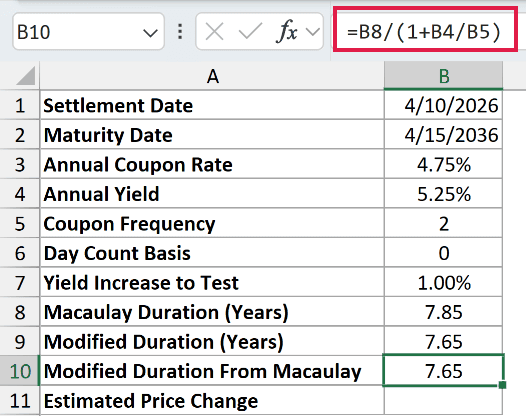
This also returns 7.65. It divides Macaulay duration by one plus the annual yield divided by the coupon frequency.
Now estimate the price change in B11:
=-B9*B7
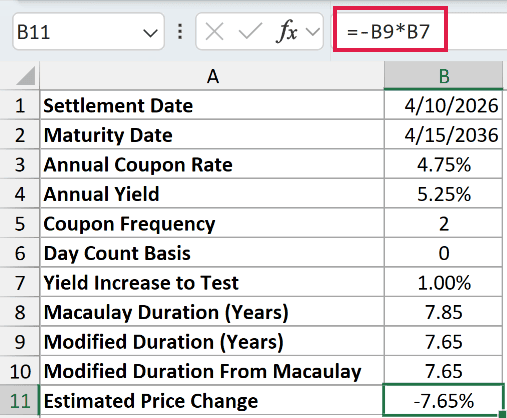
The result is -7.65%. The negative sign shows that price and yield move in opposite directions. Here, the higher yield means an estimated price drop.
B7 is a typed input, not a calculated result. Its 1.00% represents a one-percentage-point increase in yield, not a one-percent relative increase.
Pro Tip: This price change is an approximation. It ignores the curve in the price-yield relationship, called convexity, so larger yield moves can make the estimate less accurate.
Tips & Common Mistakes
- Use real dates. Invalid date arguments return
#VALUE!. Use date cells or DATE, as shown in Example 1, rather than quoted text that depends on regional settings. - Check the input limits. Settlement on or after maturity, a negative coupon or yield, an unsupported frequency, or a basis outside
0through4returns#NUM!. - Use whole-number settings. Excel truncates settlement, maturity, frequency, and basis to integers. Enter the intended dates and supported codes explicitly.
- Keep coupon and yield annual. Enter rates as percentages. Frequency tells DURATION how often coupons are paid; it doesn’t change the units of those rate inputs.
- Use MAP with LAMBDA for a spilled column. With Example 3’s inputs, the wrapper is
=MAP(A2:A8,LAMBDA(c,DURATION($E$2,$E$3,c,$E$4,$E$5,$E$6))). This requires Microsoft 365 or Excel 2024 and returns#NAME?in Excel 2021. Otherwise, use the filled-down formulas shown above. - You don’t need an add-in in current Excel. DURATION has been built in since Excel 2007. Only Excel 2003 and earlier required the Analysis ToolPak.
Use the coupon comparison to understand payment timing, and the MDURATION example when you need a price-change estimate.
Keep that estimate separate from an exact bond valuation, especially when testing larger changes in yield.
Other Excel articles you may also like:
