
The YIELD function in Excel calculates the annual yield of a security that pays periodic interest, using its price and payment terms.
For a coupon bond, you enter the settlement and maturity dates along with the coupon rate, quoted price, redemption value, and payment frequency.
The result lets you compare yield assumptions against a known price. Keep the price and redemption inputs expressed per $100 of face value.
In this article, I’ll show you how to compare bond yields, explore the effect of price changes, and understand payment-frequency and day-count settings.
YIELD Function Syntax in Excel
The YIELD function returns the annual yield of a security that pays periodic interest.
=YIELD(settlement, maturity, rate, pr, redemption, frequency, [basis])
- settlement (required) is the date when you buy the security.
- maturity (required) is the date when the security expires and the redemption amount becomes due.
- rate (required) is the security’s annual coupon rate, entered as a decimal or percentage.
- pr (required) is the quoted price per $100 of face value.
- redemption (required) is the amount repaid per $100 of face value, usually 100 for a bond redeemed at par.
- frequency (required) is 1 for annual, 2 for semiannual, or 4 for quarterly coupon payments.
- basis (optional) sets the day count method. Use 0 for US 30/360, 1 for actual/actual, 2 for actual/360, 3 for actual/365, or 4 for European 30/360.
When to Use YIELD Function
- Calculate the yield to maturity of a coupon paying bond from its quoted price.
- Compare bonds with different coupon rates, prices, and maturity dates.
- See how a bond’s quoted price affects its yield.
- Test how coupon frequency and day count basis affect the result.
- Check bond data for invalid dates, payment frequencies, or coupon rates.
Example 1: Calculate a Bond’s Yield to Maturity
Let’s start with one corporate bond bought below par.
Below is the parameter card. It contains settlement and maturity dates, coupon rate, quoted price, redemption value, payment frequency, and day count basis.
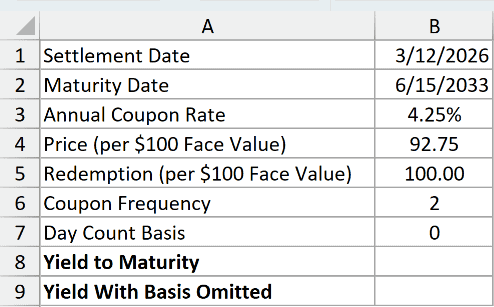
We want to calculate the bond’s annual yield to maturity from all seven inputs.
Here is the formula:
=YIELD(B1,B2,B3,B4,B5,B6,B7)
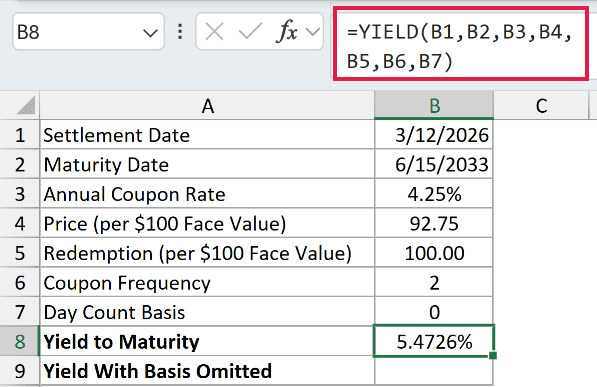
B8 displays 5.4726%. The 92.75 price is below the 100.00 redemption value, so the yield is higher than the 4.25% coupon rate.
The settlement and maturity inputs must be real Excel dates. Use date cells or the DATE function rather than text that only looks like a date.
The basis argument is optional, so we can remove B7 from the formula:
=YIELD(B1,B2,B3,B4,B5,B6)
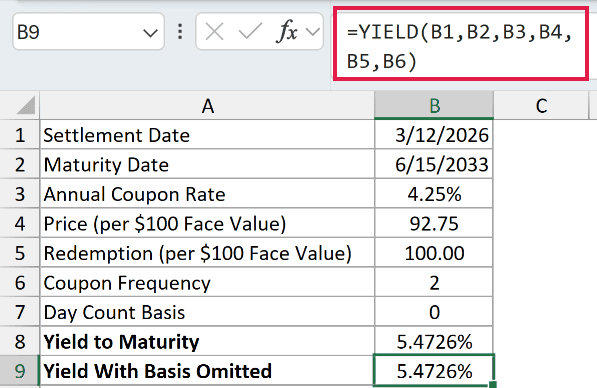
B9 also displays 5.4726%. Matching B8 confirms that an omitted basis defaults to 0, the US 30/360 convention.
Pro Tip: Price and redemption are quoted per $100 of face value. A $50,000 holding priced at 92.75 still uses 92.75 and 100, not 46,375 and 50,000.
Example 2: Compare Yields Across a Bond Watchlist
Now let’s apply the same calculation to eight bonds.
Below is the dataset. Columns A:D list bonds, maturity dates, coupon rates, and quoted prices. Empty column E awaits yield to maturity. The G:H card holds settlement and convention inputs.
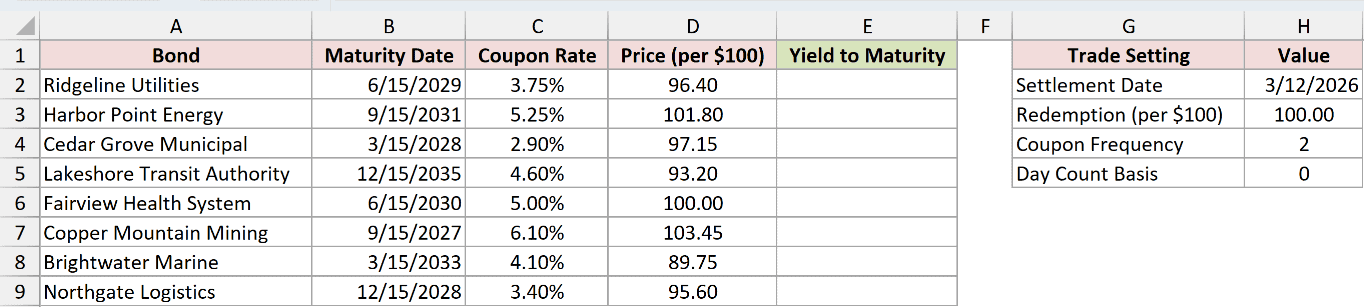
We want to calculate each bond’s yield while keeping the shared trade settings fixed.
Enter this formula in E2, then copy it down through E9:
=YIELD($H$2,B2,C2,D2,$H$3,$H$4,$H$5)
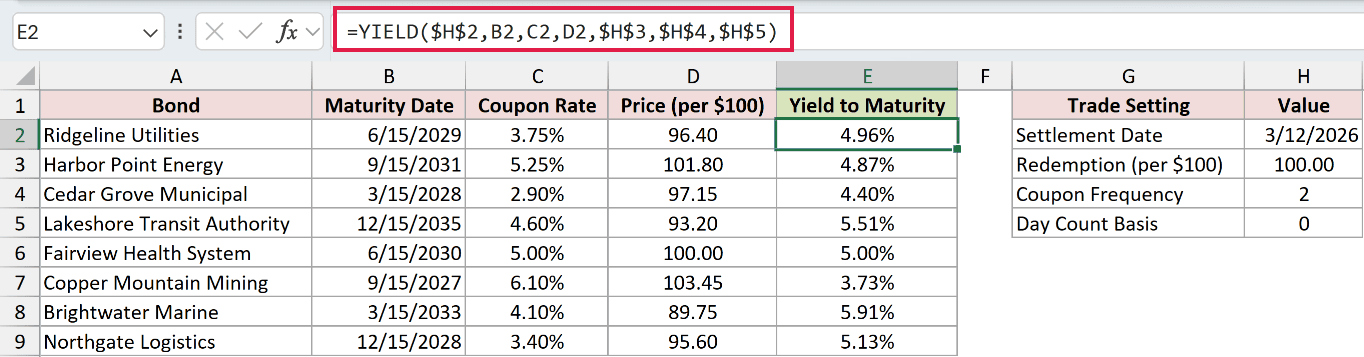
The copied formulas display these results:
- Ridgeline Utilities: 4.96%
- Harbor Point Energy: 4.87%
- Cedar Grove Municipal: 4.40%
- Lakeshore Transit Authority: 5.51%
- Fairview Health System: 5.00%
- Copper Mountain Mining: 3.73%
- Brightwater Marine: 5.91%
- Northgate Logistics: 5.13%
The absolute references keep settlement, redemption, frequency, and basis fixed. The relative references let maturity, coupon rate, and price change on each row.
Copper Mountain’s 103.45 price is above its 100.00 redemption value. Its 3.73% yield therefore sits below its 6.10% coupon rate.
Fairview is priced at 100.00 and displays a 5.00% yield against a 5.00% coupon. They are essentially equal, but settlement falls between coupon dates.
Example 3: See How Bond Price Changes Yield
Here’s the clearest way to see the relationship between price and yield.
Below is the dataset. Column A contains seven quoted prices. Empty column B awaits yield to maturity. The D:E card contains the fixed bond inputs.
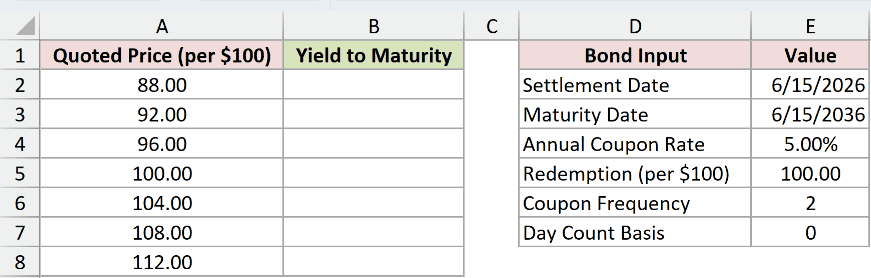
We want to recalculate the same bond at each quoted price.
Enter this formula in B2, then copy it down through B8:
=YIELD($E$2,$E$3,$E$4,A2,$E$5,$E$6,$E$7)
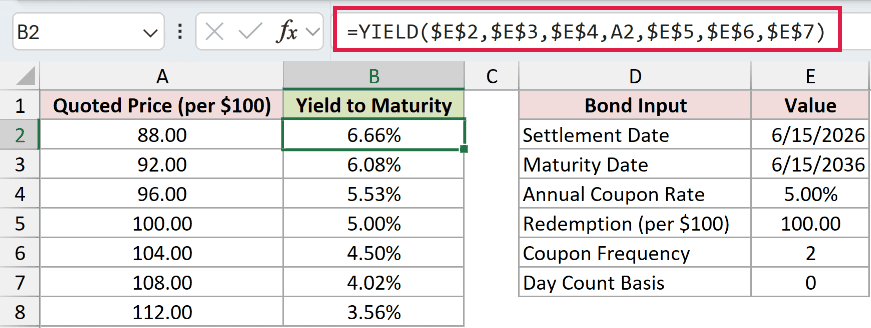
The displayed yields for prices 88.00 through 112.00 are:
- 88.00 returns 6.66%.
- 92.00 returns 6.08%.
- 96.00 returns 5.53%.
- 100.00 returns 5.00%.
- 104.00 returns 4.50%.
- 108.00 returns 4.02%.
- 112.00 returns 3.56%.
Yield falls as price rises. A discount pushes yield above the coupon rate, while a premium pulls yield below it.
The 100.00 row returns 5.00% because the bond is at par and settlement falls on a coupon date.
Example 4: What Frequency and Basis Actually Change
Next, let’s compare payment frequency with the five day count basis codes.
Below is the dataset. Columns A:C list seven frequency and basis scenarios. Empty column D awaits yield to maturity. The F:G card supplies settlement, maturity, coupon rate, and price.
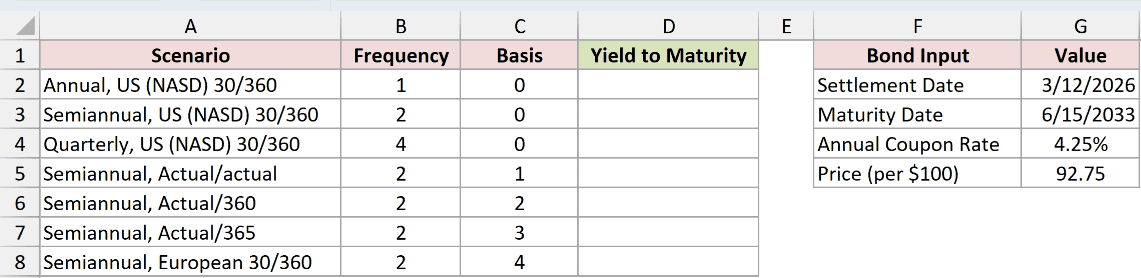
We want to see which convention changes make a visible difference for the same bond.
Redemption is entered directly as 100 because it never changes across the seven scenarios. Here, 100 means par redemption per $100 of face value.
Enter this formula in D2, then copy it down through D8:
=YIELD($G$2,$G$3,$G$4,$G$5,100,B2,C2)
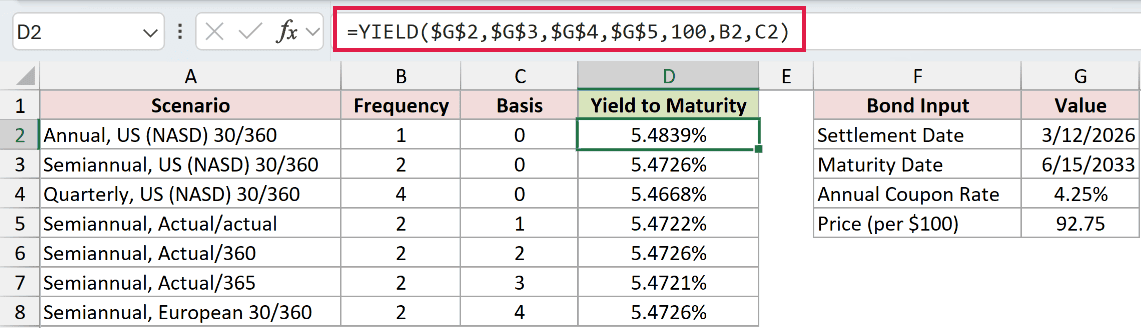
The displayed yields are:
- Annual with basis 0: 5.4839%.
- Semiannual with basis 0: 5.4726%.
- Quarterly with basis 0: 5.4668%.
- Semiannual with basis 1: 5.4722%.
- Semiannual with basis 2: 5.4726%.
- Semiannual with basis 3: 5.4721%.
- Semiannual with basis 4: 5.4726%.
Changing payment frequency produces the clearest difference. Annual, semiannual, and quarterly payments move the displayed yield from 5.4839% to 5.4726% and 5.4668%.
Day count basis barely moves this bond’s yield. Only basis 1 and basis 3 change the fourth decimal, while basis 0, 2, and 4 display 5.4726%.
Basis 4 is identical to basis 0 here.
The conventions only differ when a coupon date lands on February’s last day, which cannot occur on this bond’s June and December coupon schedule.
Example 5: Fix YIELD #NUM! Errors
Finally, let’s look at three invalid input combinations beside one valid row.
Below is the dataset. Columns A to F contain the case description, dates, coupon rate, quoted price, and payment frequency.

We want to identify why each broken row fails and what needs changing.
Enter this formula in G2, then copy it down through G5:
=YIELD(B2,C2,D2,E2,100,F2,0)

The valid row displays 5.47%. The other three results are deliberate error demonstrations:
- Settlement on or after maturity returns #NUM!. For the row shown, move the settlement date before the maturity date.
- Frequency 3 returns #NUM!. Use 1, 2, or 4.
- A negative coupon rate returns #NUM!. Enter a zero or positive annual coupon rate.
YIELD also returns #NUM! when price or redemption is zero or negative, or when basis falls outside 0 through 4.
A date stored as text can return #VALUE!. Replace it with a real date value before calculating the yield.
Tips & Common Mistakes
- Format the result cell as a percentage. YIELD returns a decimal value even though the result represents an annual rate.
- Keep settlement and maturity as real Excel dates. The function truncates their serial values, along with frequency and basis, to integers.
- Enter price and redemption per $100 of face value. Do not enter the bond’s total market value or total face value.
- Use only 1, 2, or 4 for frequency. Other values return #NUM!.
- YIELD cannot process a range directly. In Microsoft 365, Excel 2024, or Excel for the web,
=MAP(A2:A8,LAMBDA(p,YIELD($E$2,$E$3,$E$4,p,$E$5,$E$6,$E$7)))is the way to produce a spilled price ladder. - PRICE works in reverse. With the same bond inputs, it can turn a known yield back into a quoted price.
- You can check the same bond inputs outside Excel with the bond yield calculator.
The examples covered one bond, a watchlist, a price ladder, convention comparisons, and the input problems that return errors.
Once the dates and per $100 inputs are correct, frequency and day count basis handle the remaining bond conventions.
Related Excel Functions / Articles:
