
Excel’s MDURATION function returns a bond’s modified duration from its settlement date, maturity date, coupon rate, yield, coupon frequency, and day-count basis.
Modified duration estimates how strongly a bond’s price will move when its yield changes. A higher result means greater interest-rate sensitivity.
In this article, I’ll show you how to estimate percentage and dollar price changes, compare the estimate with full repricing, and calculate portfolio modified duration.
MDURATION Function Syntax in Excel
The MDURATION function uses five required arguments and one optional day-count basis.
=MDURATION(settlement, maturity, coupon, yld, frequency, [basis])
- settlement (required) is the bond’s settlement date.
- maturity (required) is the date when the bond matures.
- coupon (required) is the bond’s annual coupon rate.
- yld (required) is the bond’s annual yield.
- frequency (required) is the number of coupon payments per year. Use 1 for annual, 2 for semiannual, or 4 for quarterly payments.
- basis (optional) sets the day-count convention. Use 0 or omit it for US 30/360, 1 for actual/actual, 2 for actual/360, 3 for actual/365, or 4 for European 30/360.
Use date cells or the DATE function for the date arguments because text dates can depend on regional settings.
When to Use MDURATION Function
- Estimate a bond’s percentage price change after a small yield move.
- Convert rate sensitivity into an estimated dollar change for a position.
- Compare interest-rate risk across several bonds.
- Calculate market-value-weighted modified duration for a portfolio.
- Convert Macaulay duration from DURATION into modified duration.
Example 1: Calculate a Bond’s Modified Duration
Let’s start with one semiannual coupon bond.
Below is the dataset. The card lists six bond inputs, while the Modified Duration label and empty bordered cell show where the result will appear.
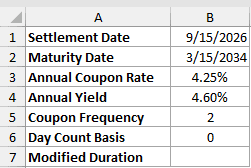
We want to calculate the bond’s modified duration in B7.
Here is the formula:
=MDURATION(B1,B2,B3,B4,B5,B6)
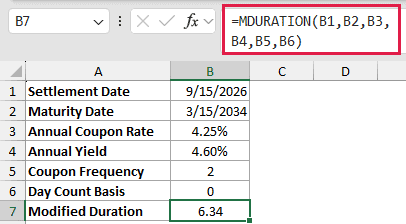
The formula returns 6.34. A one percentage point rise in yield would produce an estimated price decline of about 6.34%, before convexity effects.
Settlement and maturity come from date cells. Frequency 2 means semiannual coupons, and basis 0 uses the US 30/360 convention.
Example 2: Estimate Price Changes From Yield Moves
Now let’s test several yield-change scenarios for one bond position.
Below is the dataset. Columns A:C contain seven yield changes and empty estimate columns. The bond card includes market value and an empty Modified Duration cell.
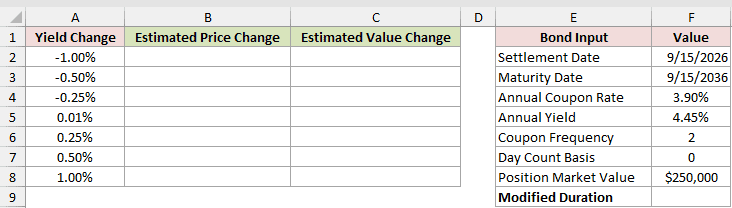
We want the bond’s modified duration, estimated percentage changes, and estimated dollar changes.
Start by calculating modified duration in F9:
=MDURATION(F2,F3,F4,F5,F6,F7)
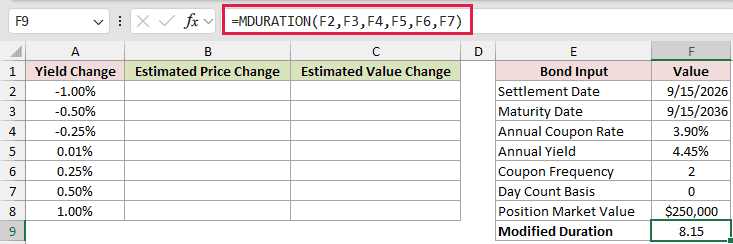
The formula returns 8.15 for this bond.
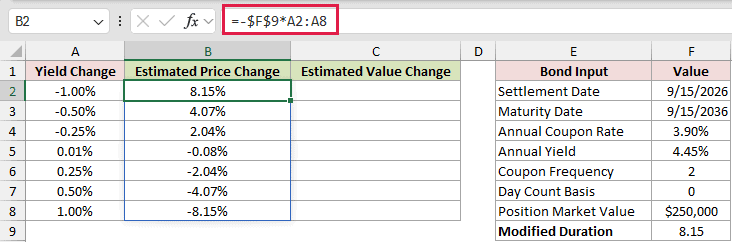
Now enter the estimated percentage price change in B2. This one formula spills down column B:
=-$F$9*A2:A8
Next, enter the dollar change formula in C2. This one formula spills down column C for the $250,000 position:
=B2:B8*$F$8
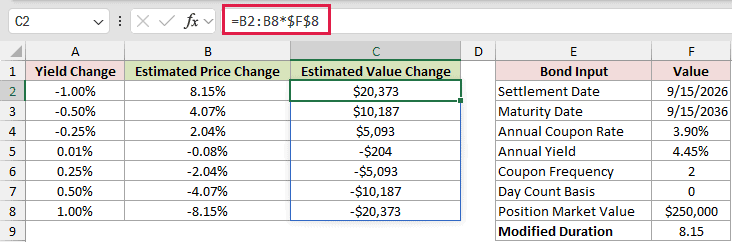
The minus sign reverses the direction. A 1.00% yield decrease produces an estimated 8.15% price gain, while a yield increase produces a price decline.
For the first row, the estimated value change is $20,373. The 0.01% row estimates DV01, the dollar value of a one-basis-point yield move.
Both table formulas spill in Excel 2021, Excel 2024, and Microsoft 365.
In Excel 2019 or earlier, enter =-$F$9*A2 in B2 and fill it down to row 8. Enter =B2*$F$8 in C2 and fill it down to row 8.
Example 3: Compare the Estimate With Full Repricing
Here’s a longer bond where larger yield moves make the estimate’s limits easier to see.
Below is the dataset. Columns A:C hold yield changes and empty comparison columns. The bond card has empty cells for Current Price and Modified Duration.
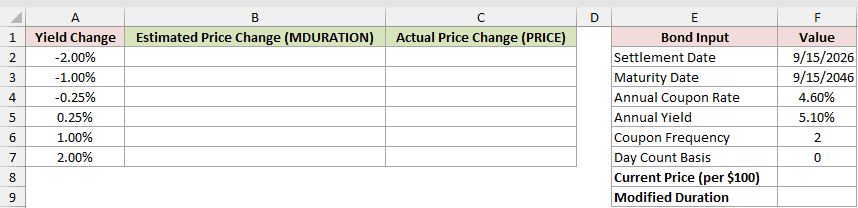
We want to compare MDURATION’s linear estimates with bond prices recalculated at each scenario yield.
First, calculate the current price per $100 in F8:
=PRICE(F2,F3,F4,F5,100,F6,F7)
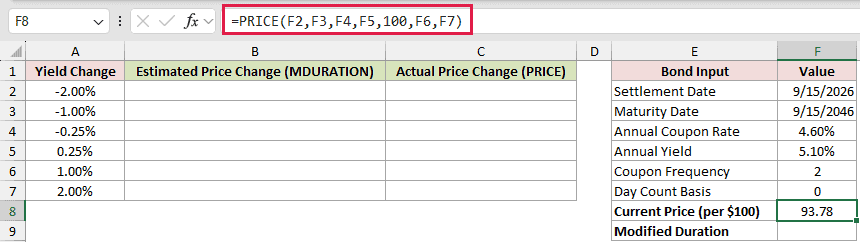
The current price is 93.78.
Next, calculate modified duration in F9:
=MDURATION(F2,F3,F4,F5,F6,F7)
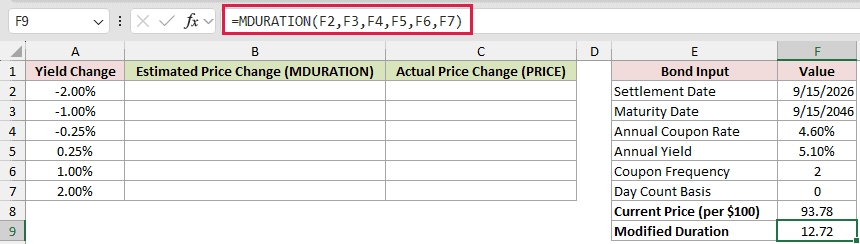
The bond’s modified duration is 12.72.
Now enter the percentage estimate in B2. This one formula spills down column B:
=-$F$9*A2:A7
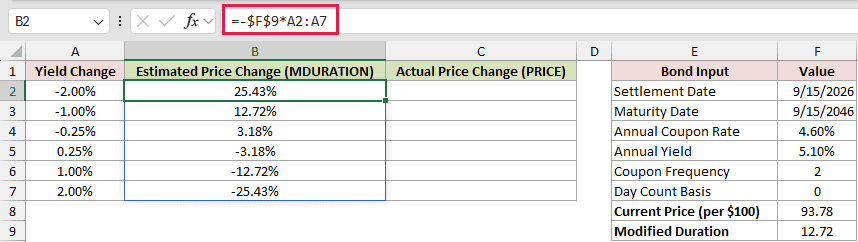
In Excel 2021, Excel 2024, and Microsoft 365, the formula spills from B2 through B7.
In Excel 2019 or earlier, enter =-$F$9*A2 in B2 and fill it down to B7.
Finally, enter the PRICE comparison in C2 and copy it down:
=PRICE($F$2,$F$3,$F$4,$F$5+A2,100,$F$6,$F$7)/$F$8-1
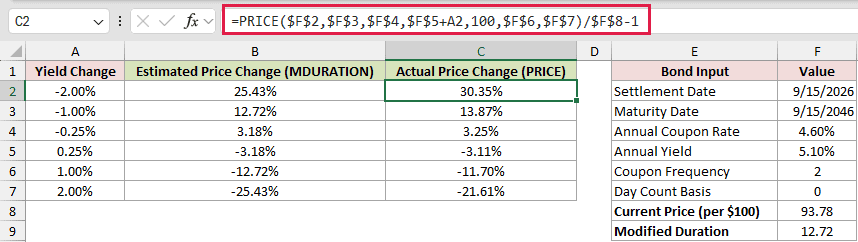
At a 2.00% yield decrease, MDURATION estimates a 25.43% gain. Full repricing returns 30.35%, a wider increase because the price-yield relationship is curved.
For positive yield moves, the exact price decline is smaller than the linear estimate. The gap grows as the yield move becomes larger.
Modified duration works best for small yield changes. PRICE provides the better check when a move is large.
Example 4: Compare Rate Risk Across a Bond Ladder
Let’s apply MDURATION to a six-bond ladder.
Below is the dataset. It lists six holdings, an empty Modified Duration column, a portfolio settings card, and an empty Portfolio Modified Duration cell.
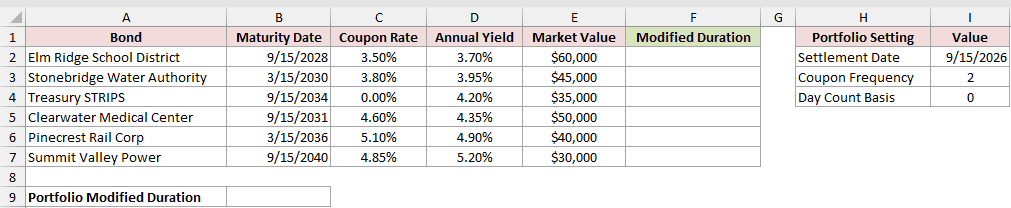
We want each bond’s modified duration and one market-value-weighted duration for the portfolio.
Enter this formula in F2 and copy it down:
=MDURATION($I$2,B2,C2,D2,$I$3,$I$4)
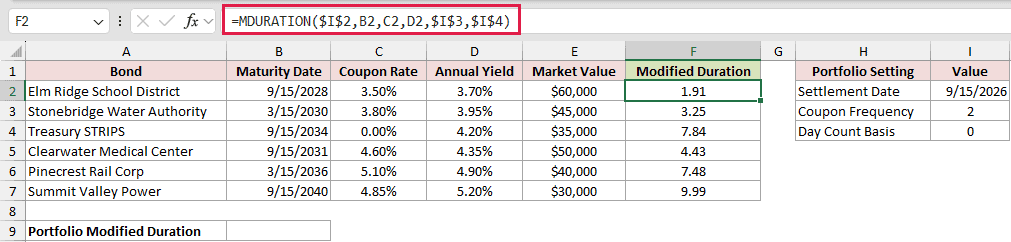
MDURATION returns 1.91 for Elm Ridge School District.
Now calculate the portfolio’s market-value-weighted modified duration in B9:
=SUMPRODUCT(E2:E7,F2:F7)/SUM(E2:E7)
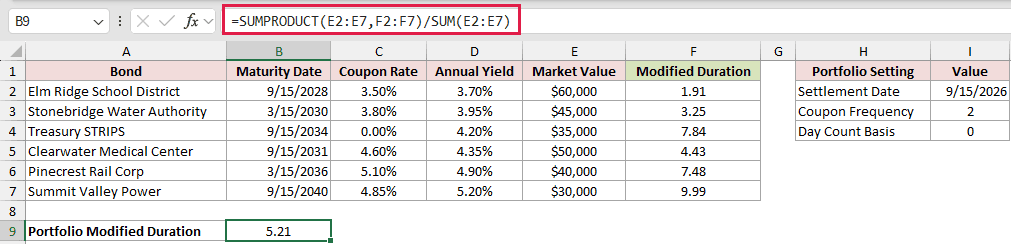
SUMPRODUCT weights each duration by market value, and SUM divides by the total value. The portfolio modified duration is 5.21.
The Treasury STRIPS row uses a 0.00% coupon, which MDURATION accepts as a valid coupon input.
For this table, fill MDURATION down rather than passing the whole range.
Example 5: Convert DURATION to MDURATION
This example shows the relationship between Macaulay duration and modified duration.
Below is the dataset. Column A lists annual yields, columns B:D have empty result cells, and the bond input card sits in columns F:G.

We want to compare DURATION, MDURATION, and the manual conversion at each yield.
Enter the DURATION formula in B2 and copy it down:
=DURATION($G$2,$G$3,$G$4,A2,$G$5,$G$6)

Next, enter MDURATION in C2 and copy it down:
=MDURATION($G$2,$G$3,$G$4,A2,$G$5,$G$6)

Then enter the manual conversion in D2 and copy it down:
=B2/(1+A2/$G$5)

At a 2.00% yield, DURATION returns 6.23. MDURATION and the manual calculation both return 6.17.
Column D confirms that modified duration equals Macaulay duration divided by 1 plus annual yield divided by coupon frequency.
As yield rises down the table, the gap between DURATION and MDURATION gets wider.
Example 6: Start From a Quoted Bond Price
Sometimes a bond quote provides price but not yield.
Below is the dataset. The card contains the quoted price and other bond inputs, followed by empty cells for Yield to Maturity and Modified Duration.
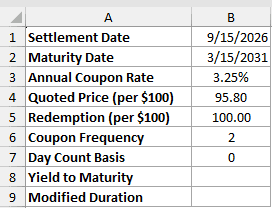
We want to calculate yield from the quoted price, then pass that result to MDURATION.
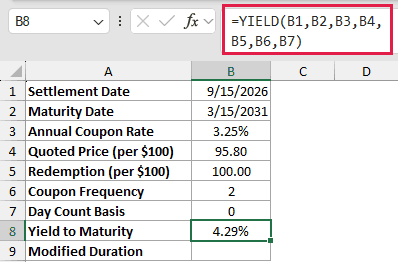
First, calculate yield to maturity in B8:
=YIELD(B1,B2,B3,B4,B5,B6,B7)
Now use the calculated yield in the MDURATION formula:
=MDURATION(B1,B2,B3,B8,B6,B7)
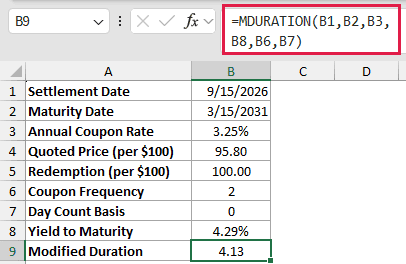
YIELD returns 4.29% from the quoted price of 95.80. MDURATION then uses B8 as its annual yield and returns 4.13.
This two-step layout keeps the calculated yield visible, which makes the bond inputs easier to audit.
Example 7: Fix Common MDURATION Input Mistakes
The last example puts common input mistakes beside a correct row.
Below is the dataset. Column A labels one correct row plus five rows with mistakes.
The mistakes are coupon typed as 4.5, yield typed as 4.75, frequency 12, swapped dates, and negative yield.
The green Modified Duration column contains empty bordered result cells.

We want to see which inputs return a misleading number and which produce an error.
Enter this formula in G2 and copy it down:
=MDURATION(B2,C2,D2,E2,F2)
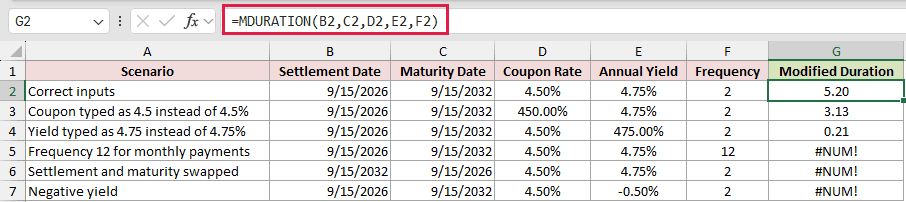
The correct row returns 5.20. Typing 4.5 instead of 4.5% makes the coupon 450%, while 4.75 makes the yield 475%.
The coupon mistake returns 3.13, a plausible-looking duration, while the yield mistake returns 0.21. Both are wrong compared with the correct result of 5.20.
Frequency must be 1, 2, or 4. A frequency of 12, reversed dates, and a negative yield return #NUM!.
Basis is omitted here, so Excel uses 0, the US 30/360 convention.
Tips & Common Mistakes
- Enter coupon and yield as decimals or percentage-formatted cells. For example, 4.5% is stored as 0.045, not 4.5.
- Keep settlement earlier than maturity, and use valid Excel dates. Invalid date inputs return
#VALUE!. - Use frequency 1, 2, or 4 to match the bond’s actual coupon schedule.
- Keep the day-count basis consistent with the bond’s pricing convention.
- Format MDURATION results as
0.00. A cell can keep a currency format left over from an earlier result. - Treat yield changes as percentage-point changes. A move from 4.45% to 4.95% is 0.50%, or 0.005 in the calculation.
- Use current market value, not face value, when converting an estimated percentage change into a position-level dollar change.
- Fill MDURATION down for several bonds. A plain multi-cell range returns one
#VALUE!instead of spilling.
MDURATION is most useful when you treat it as a sensitivity estimate rather than an exact price forecast.
The result can support single-bond scenarios, full-repricing checks, and market-value-weighted portfolio risk.
Other Excel articles you may also like:
