
Excel’s PRICE function returns the clean price per $100 of face value for a bond that pays periodic interest, excluding accrued interest at settlement.
You can use it to calculate a bond’s quoted price from its coupon rate and yield, or compare how different yields affect the quote.
Scale the result to value a larger holding. The cash amount due at settlement can also include accrued interest.
In this article, I’ll show you how to calculate a bond’s price and holding value, compare payment settings, and test sensitivity to yield changes.
PRICE Function Syntax in Excel
The PRICE function uses this syntax:
=PRICE(settlement, maturity, rate, yld, redemption, frequency, [basis])
settlementis the date the buyer purchases the security.maturityis the date the security expires.rateis the annual coupon rate.yldis the security’s annual yield.redemptionis the redemption value per $100 of face value.frequencyis the number of coupon payments each year: 1 for annual, 2 for semiannual, or 4 for quarterly.basisis optional and sets the day count method. Use 0 for US 30/360, 1 for Actual/actual, 2 for Actual/360, 3 for Actual/365, or 4 for European 30/360.
If you omit basis, Excel uses 0, which is US 30/360.
When to Use PRICE Function
- Price a periodic-coupon bond when its yield is known.
- Convert a per-$100 quote into the quoted value of a larger holding.
- Compare annual, semiannual, and quarterly coupon frequencies.
- Test how different yields affect a bond’s quoted price.
Example 1: Calculate a Bond Price
We’ll begin with a semiannual municipal bond.
Below is the parameter card with the dates, rates, redemption value, frequency, and basis.
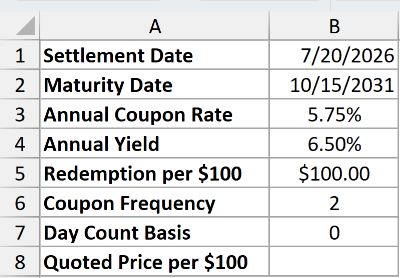
I want the quoted price per $100 for this bond on July 20, 2026.
Here is the formula:
=PRICE(B1,B2,B3,B4,B5,B6,B7)
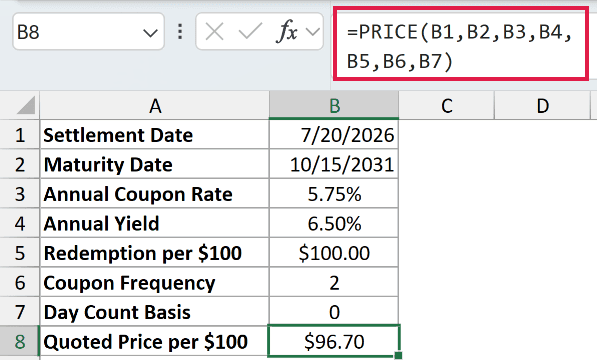
The coupon rate is 5.75%, the yield is 6.50%, and the redemption value is $100. Frequency 2 means two coupon payments per year.
Basis 0 uses the US 30/360 day count method. With these inputs, PRICE returns 96.704526, displayed as $96.70 per $100 of face value.
The July 20 settlement falls between coupon dates. PRICE accounts for that position in the coupon period when calculating the clean quote.
Pro Tip: Enter settlement and maturity as real Excel dates or create them with the DATE function. Text dates can produce a #VALUE! error.
Example 2: Convert PRICE to a Holding Value
The PRICE result is a quote per $100, even when the holding has a much larger face value.
Below is the same bond with a $250,000 face-value holding added to the parameter card.
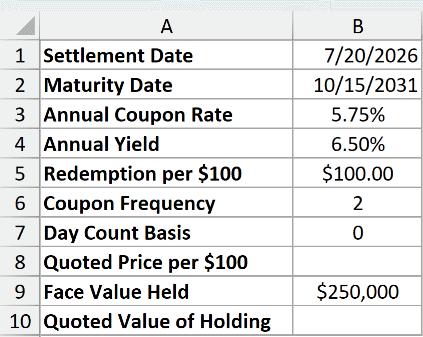
I want to calculate the per-$100 quote first, then convert it to the quoted value of the full holding.
Here is the PRICE formula:
=PRICE(B1,B2,B3,B4,B5,B6,B7)
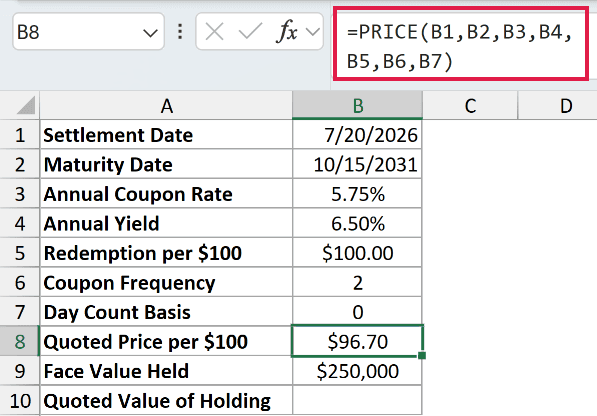
The formula returns the same $96.70 quote as the first example.
Now use this formula to scale that quote to the $250,000 face value:
=B8/100*B9
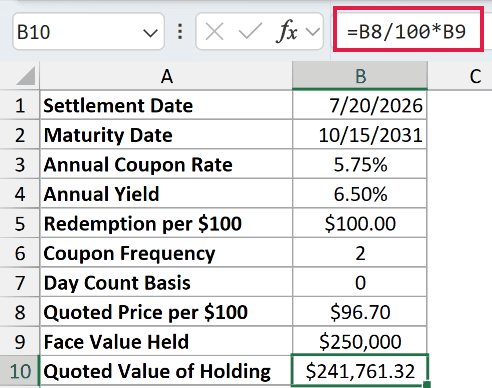
Dividing B8 by 100 converts the quote to a rate per dollar. Multiplying by B9 returns a quoted holding value of $241,761.32.
Pro Tip: This is a clean quoted value. The cash amount due at settlement can include accrued interest, which PRICE does not add to its result.
Example 3: Compare Frequency and Basis
Frequency and day count basis can both affect the quoted price.
Below are five rows using the same dates, coupon rate, yield, and redemption value with different frequency or basis settings.

I want to calculate a separate price for every combination in the table.
Enter this formula in H2 and copy it down through H6:
=PRICE(A2,B2,C2,D2,E2,F2,G2)
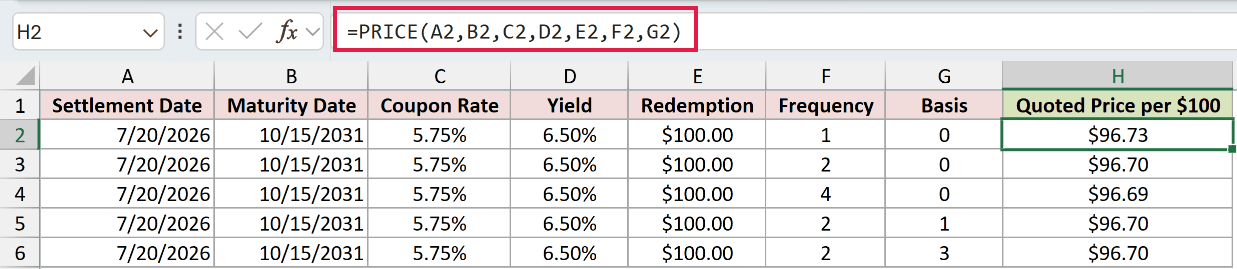
The first three rows use annual, semiannual, and quarterly coupons with basis 0. Their displayed prices are $96.73, $96.70, and $96.69.
The last two rows use semiannual coupons with Actual/actual and Actual/365. Both display as $96.70 for this bond after rounding to cents.
The underlying results are slightly different, so keep more decimal places when those small differences matter.
Example 4: Build a Yield Sensitivity Table
Bond prices generally move in the opposite direction from yields when the other inputs stay fixed.
Below is a table of five annual yields from 4.50% through 8.50%.
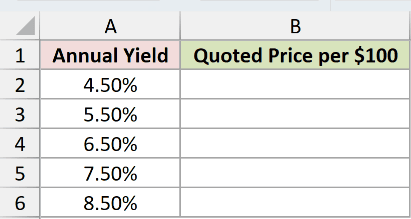
I want to calculate the quoted price for each yield without passing the entire yield range to PRICE.
Enter this formula in B2 and copy it down through B6:
=PRICE(DATE(2026,7,20),DATE(2031,10,15),5.75%,A2,100,2,0)
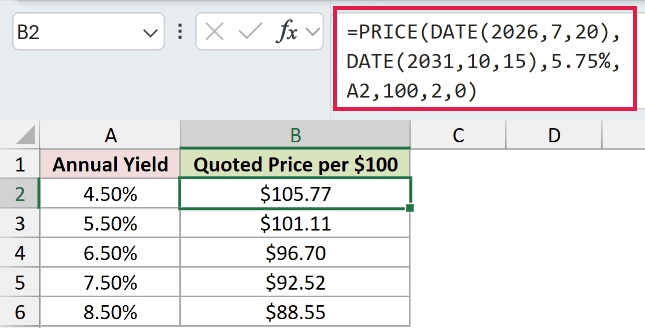
The formula returns $105.77 at a 4.50% yield and $88.55 at an 8.50% yield. The middle 6.50% row returns $96.70.
Each row uses one scalar yield from column A. Passing A2:A6 directly to PRICE returns #VALUE! instead of a spilled price list.
Pro Tip: Fill the formula down for a watchlist or sensitivity table. Direct range arguments return #VALUE! instead of a spilled result.
Tips & Common Mistakes
- Remember that PRICE returns a clean quote per $100 of face value, not the total value of the holding.
- Use 1, 2, or 4 for
frequency. Any other number returns a#NUM!error. - Keep
basisbetween 0 and 4. A value outside that range returns a#NUM!error. - Make sure settlement is earlier than maturity. Otherwise, PRICE returns a
#NUM!error. - Use PRICEDISC for a discounted security and PRICEMAT for a security that pays interest at maturity.
- Use YIELD when the price is known and you need to solve for the yield.
I covered a basic bond price, a face-value conversion, frequency and basis comparisons, and a yield sensitivity table.
I hope you found this article helpful.
Other Excel articles you may also like:
