
Excel’s VAR.P function calculates variance for an entire population. Variance measures how far values spread from their mean, using the squared unit of the original data.
Use VAR.P only when your data contains every member of the group you want to analyze. If the values are a sample, use VAR.S instead.
In this article, I’ll show you how to compare population and sample variance, calculate variance for a selected group, and assess process consistency with VAR.P.
VAR.P Function Syntax in Excel
The VAR.P function uses the following syntax:
=VAR.P(number1,[number2],...)
- number1: The first number, range, array, or reference for the population.
- number2, …: Optional additional population values, ranges, arrays, or references. VAR.P accepts up to 254 number arguments.
When to Use VAR.P Function
- Measure variation across every item in a complete production run.
- Compare the consistency of two complete processes.
- Calculate variance for one full group selected from a larger table.
- Analyze a known population rather than estimate from a sample.
Example 1: Compare VAR.P and VAR.S
Let’s begin with one complete production run.
Below is the dataset with the fill weights of all eight containers produced during the run.
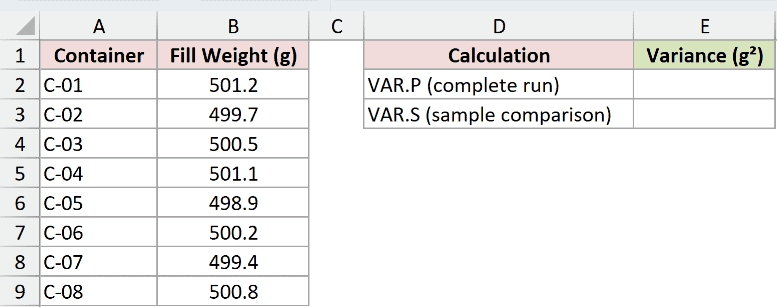
I want to calculate the population variance for the complete set of containers.
Here is the VAR.P formula:
=VAR.P(B2:B9)
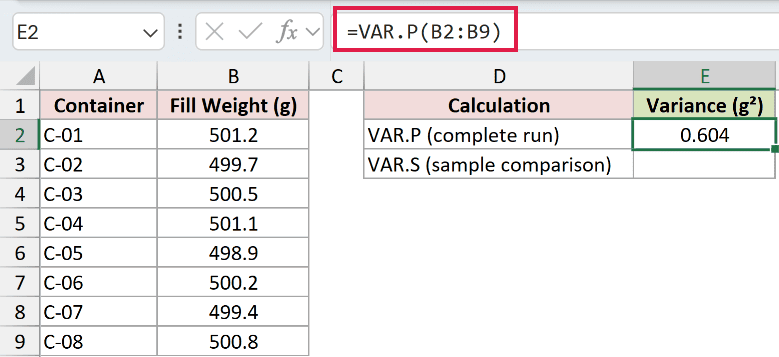
The formula returns 0.604 g². Excel subtracts the mean from each value, squares those differences, and divides their sum by all eight observations.
For comparison, here is the sample-variance formula:
=VAR.S(B2:B9)
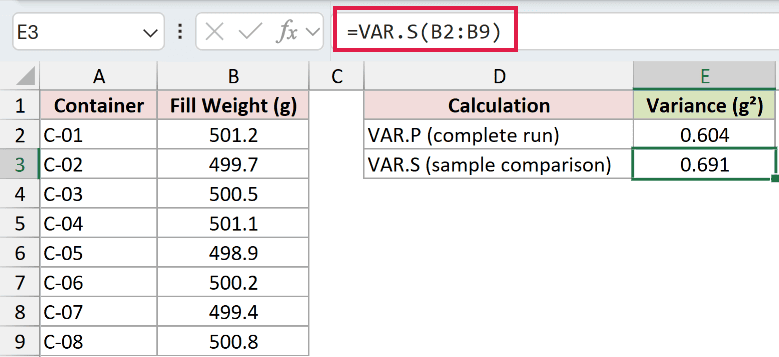
VAR.S returns 0.691 g² because it divides by seven, which is n minus 1. The larger denominator used by VAR.P produces the smaller result.
Pro Tip: Variance uses squared units. A result of 0.604 g² measures spread, but it is not a weight in grams. Use standard deviation when you need the original unit.
Example 2: Handle Text and Logical Values
This example shows why the location of a value matters.
Below is the dataset with numbers, numeric text, a logical value, and a text label.
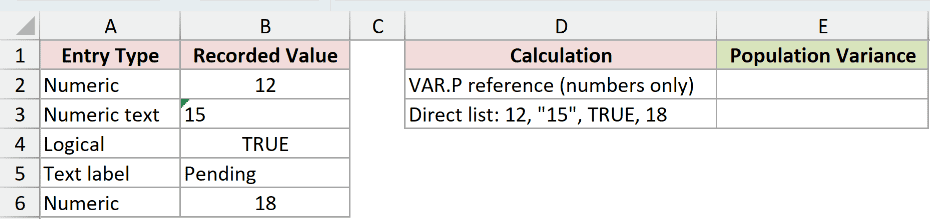
I want to compare a referenced range with the same kinds of values typed directly into the formula.
Here is the formula using the worksheet range:
=VAR.P(B2:B6)
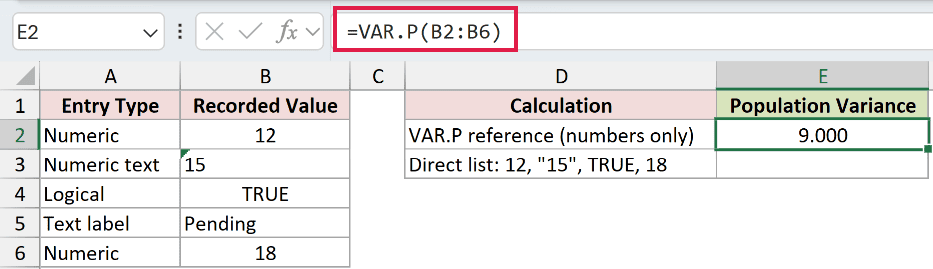
Inside the reference, VAR.P counts only 12 and 18. It ignores the text value “15,” TRUE, and the Pending label, so the result is 9.000.
Now type the numeric text and logical value directly into the argument list:
=VAR.P(12,"15",TRUE,18)
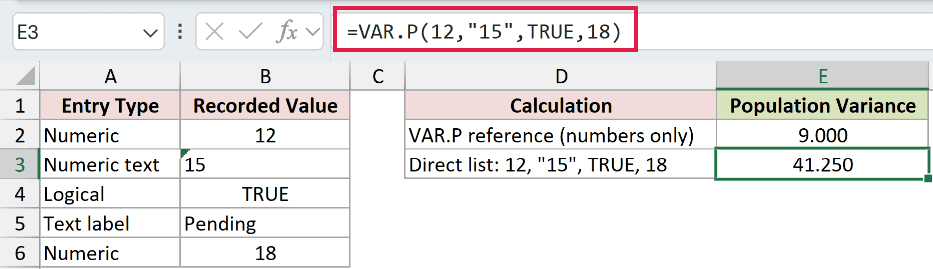
Direct arguments behave differently. Excel counts “15” as 15 and TRUE as 1, producing a population variance of 41.250.
Pro Tip: Use VARPA when logical values and text in a reference should count. VARPA treats TRUE as 1 and FALSE or text labels as 0.
Example 3: Calculate Conditional Population Variance
You can combine VAR.P with FILTER to analyze one complete group.
Below is the dataset with packing times for three delivery zones and a cell containing the selected zone.
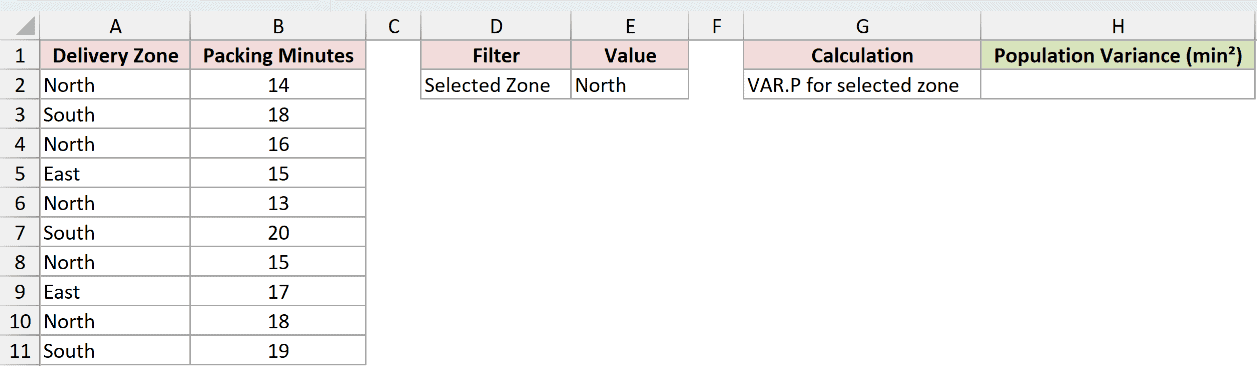
I want the population variance for all five North-zone packing times.
Here is the formula:
=VAR.P(FILTER(B2:B11,A2:A11=$E$2))
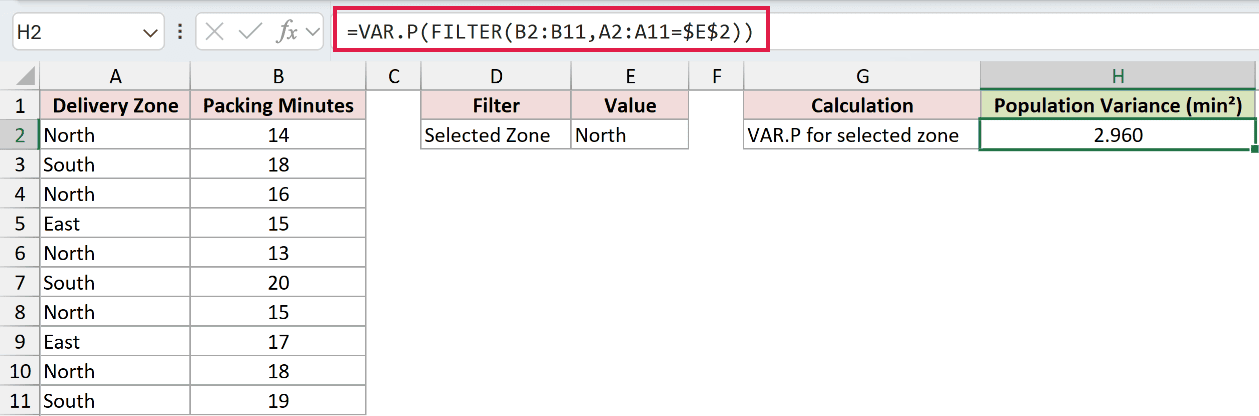
FILTER returns the North values 14, 16, 13, 15, and 18. VAR.P reduces that array to one population variance of 2.960 min².
Pro Tip: This formula requires FILTER, which is available in Microsoft 365, Excel 2024, and Excel 2021. VAR.P itself also works in Excel 2019 and Excel 2016.
Example 4: Compare Process Consistency
The final example turns population variance into a practical comparison.
Below is the dataset with all eight calibration weights from two dispensers.
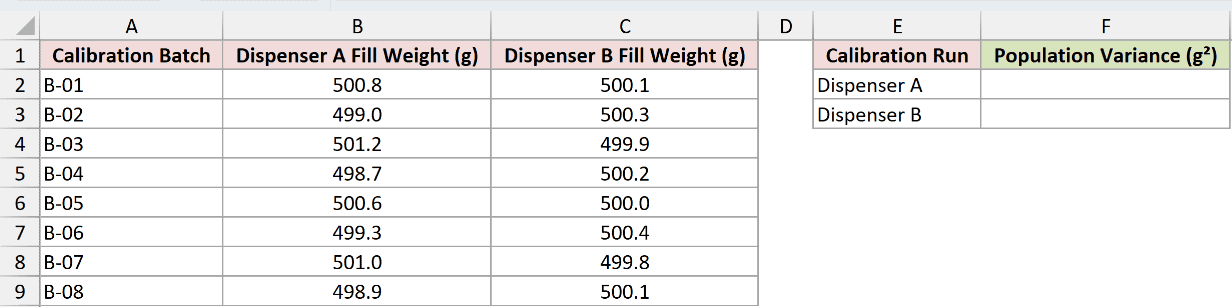
I want to identify which complete calibration run has more consistent fill weights.
Here is the formula for Dispenser A:
=VAR.P(B2:B9)
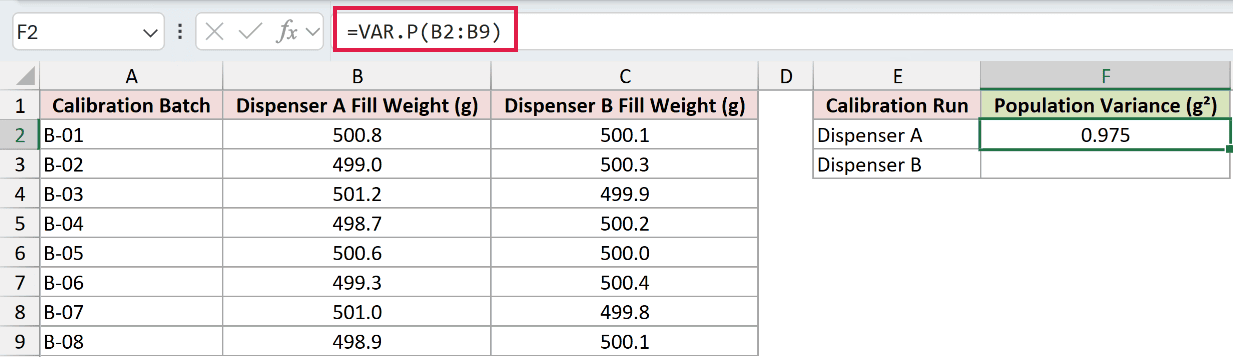
And here is the formula for Dispenser B:
=VAR.P(C2:C9)
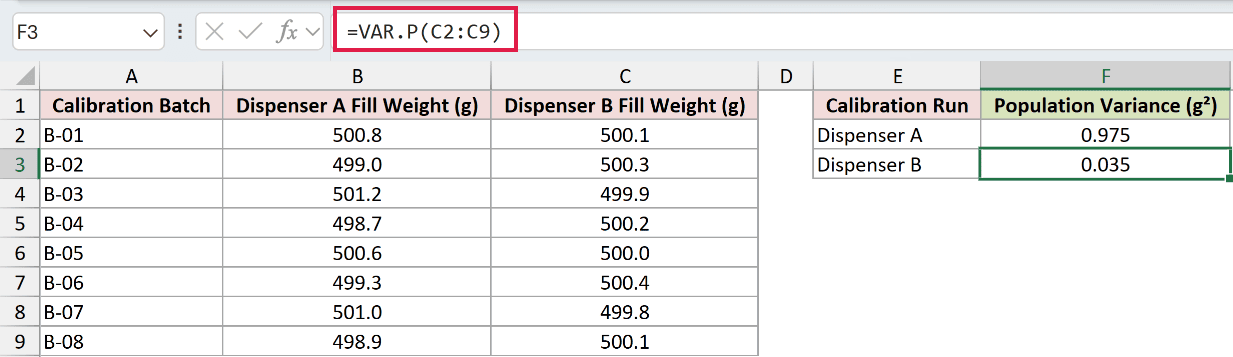
Dispenser A returns 0.975 g², while Dispenser B returns 0.035 g². The lower variance shows that Dispenser B’s weights cluster much closer to their mean.
Pro Tip: A lower variance means greater consistency, but it does not show whether the process is centered on its target. Check the mean as well.
Tips & Common Mistakes
- Choose VAR.P only when the values represent the entire population. Use VAR.S for a sample from a larger group.
- VAR.P returns one value from a range or array. It does not spill multiple results by itself.
- Empty cells, logical values, and text inside a reference are ignored. Worksheet errors still propagate, so correct them before calculating variance.
- Use VARPA when logical values and text in references should affect the result.
- Replace the legacy VARP function with VAR.P unless an older workbook requires compatibility.
- Remember that variance is expressed in squared units. Standard deviation is usually easier to compare with the original measurements.
I covered complete populations, the VAR.S comparison, data-type behavior, conditional variance, and process consistency.
I hope you found this article helpful.
Related Excel Functions / Articles:
