
Excel’s BESSELI function returns the modified Bessel function of the first kind for a specified value and order.
It appears in circular statistics, probability models, signal processing, and physical systems where a response grows or decays around a cylindrical shape.
In this article, I’ll show you how to evaluate BESSELI, model directional data and goal margins, calculate filter weights, and handle unusual inputs.
BESSELI Function Syntax in Excel
The BESSELI function needs the value to evaluate and the function order.
=BESSELI(x, n)
- x (required) is the numeric value at which you want to evaluate the function.
- n (required) is the order. Excel truncates a decimal order to an integer, and a negative order returns #NUM!.
When to Use BESSELI Function
- Evaluate the modified Bessel function of the first kind for engineering or mathematical models.
- Normalize circular probability models for wind directions, headings, or other angles.
- Convert a circular concentration value into a measure of directional spread.
- Calculate probabilities for the difference between two Poisson counts.
- Build Kaiser window weights for signal processing.
Example 1: Evaluate Different Values and Orders
Let’s start by seeing how both arguments affect the result.
Below is the dataset. Columns A and B contain x values and orders, while the green header and empty cells in column C mark the BESSELI results.
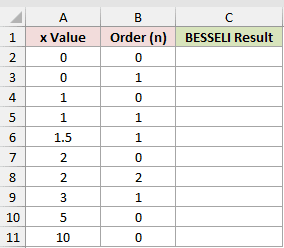
Column C should return the modified Bessel value for each x and order pair.
Here is the formula entered in C2 and copied down:
=BESSELI(A2,B2)
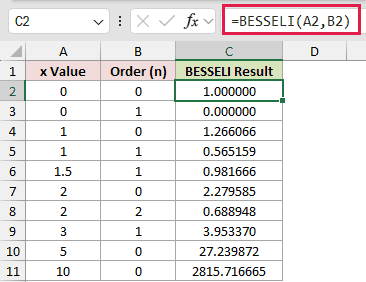
The first two rows show that BESSELI returns 1.000000 for x 0 with order 0, and 0.000000 for x 0 with order 1.
For the nonnegative x values shown, results can grow quickly. The order 0 result rises from 2.279585 at x 2 to 2815.716665 at x 10.
The same x can return a different value at another order. At x 2, order 0 returns 2.279585, while order 2 returns 0.688948.
Pro Tip: A plain range reference returns one #VALUE! instead of spilling. In Excel 2021, Excel 2024, and Microsoft 365, =BESSELI(A2:A11+0,B2:B11+0) spills the pairs.
Example 2: Estimate Wind Direction Shares
Here’s a circular statistics example using eight compass directions.
Below is the dataset. It shows eight compass directions and headings, with the green “Share of Hours” header above empty bordered cells in C2:C9.
The cards in E:F show Prevailing Direction (°) = 225 and Concentration (Kappa) = 1.5.
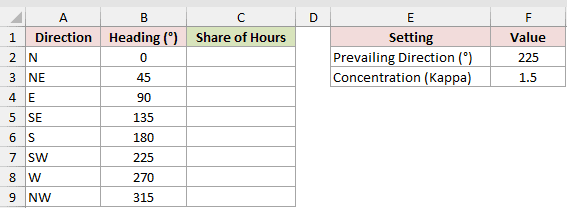
Column C should estimate the share of hours assigned to each 45° direction sector.
Here is the formula entered in C2 and copied down:
=EXP($F$3*COS(RADIANS(B2-$F$2)))/(8*BESSELI($F$3,0))
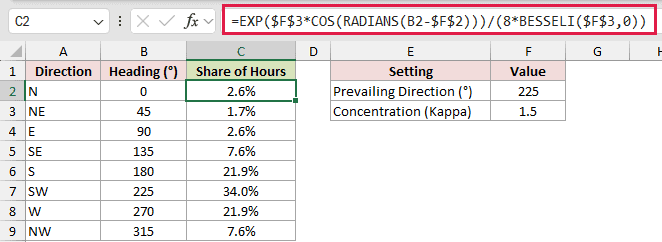
This is a discrete von Mises model, often described as a circular version of the normal distribution.
RADIANS converts each heading difference before COS evaluates it. BESSELI uses the concentration value in F3 to normalize the eight sector shares.
Southwest matches the prevailing direction and returns the largest share at 34.0%. South and west each return 21.9% because they are equally far away.
Example 3: Convert Concentration Into Directional Spread
Now let’s turn several concentration values into easier measures of directional clustering.
Below is the dataset. The screenshot shows kappa values in column A and green “Mean Resultant Length” and “Circular Std Dev (°)” headers above empty bordered cells in B2:C9.
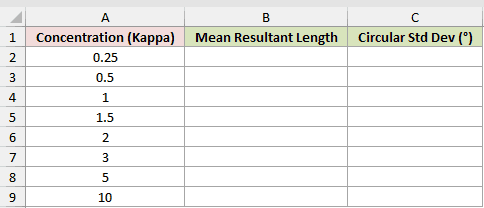
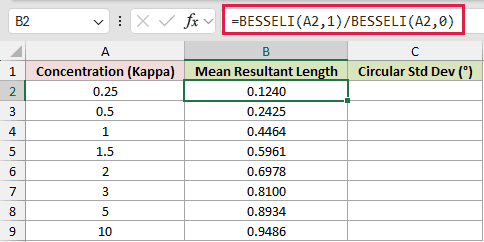
First, column B should calculate the mean resultant length for each concentration value.
Here is the formula entered in B2 and copied down:
=BESSELI(A2,1)/BESSELI(A2,0)
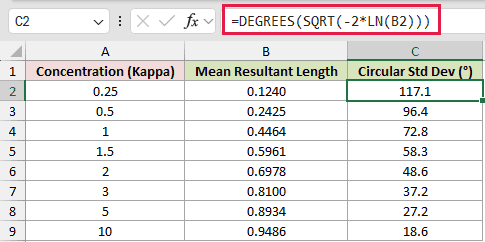
Next, column C should convert that result into a circular standard deviation measured in degrees.
Here is the formula entered in C2 and copied down:
=DEGREES(SQRT(-2*LN(B2)))
The first formula divides order 1 by order 0 at the same kappa. A result closer to 1 means the directions are more tightly clustered.
The second formula translates that concentration measure into degrees. At kappa 1.5, the mean resultant length is 0.5961 and the circular standard deviation is 58.3°.
As kappa rises from 0.25 to 10, the displayed standard deviation falls from 117.1° to 18.6°.
Example 4: Calculate Goal Margin Probabilities
Here’s a probability model for the difference between two teams’ goal counts.
Below is the dataset. In the screenshot, goal margins run from -4 to 4 beneath column A, while the green “Probability” header sits above empty bordered cells in B2:B10.
The cards show Home Team Avg Goals = 1.6 in E2 and Away Team Avg Goals = 1.1 in E3.
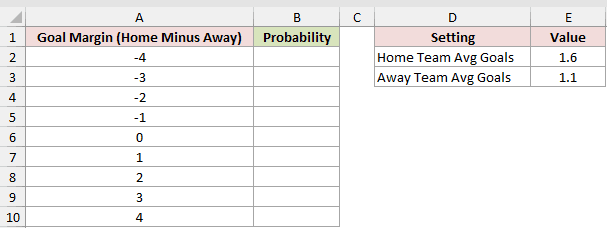
Column B should return the probability of each listed home minus away goal margin.
Here is the formula entered in B2 and copied down:
=EXP(-($E$2+$E$3))*($E$2/$E$3)^(A2/2)*BESSELI(2*SQRT($E$2*$E$3),ABS(A2))
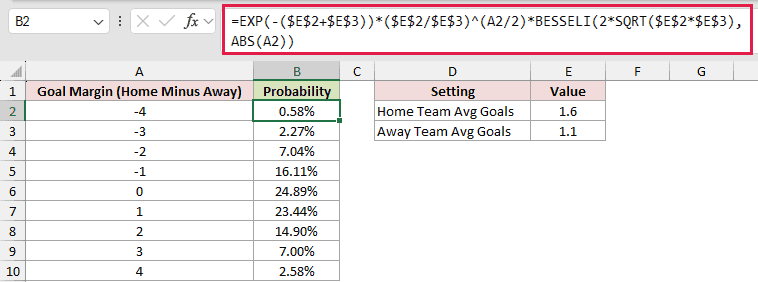
This formula applies the Skellam distribution, which models the difference between two independent Poisson counts.
ABS converts every margin into a nonnegative BESSELI order. That matters because a negative order returns #NUM!.
The draw row, where the margin is 0, returns 24.89%. A one-goal home margin returns 23.44%, compared with 16.11% for a one-goal away margin.
The unequal averages in E2 and E3 create that difference between positive and negative margins.
Example 5: Calculate Kaiser Window Weights
Let’s use BESSELI to shape a nine-tap signal processing window.
Below is the dataset. The screenshot numbers taps 0 through 8 in column A and lists positions from center, -1 to 1 in 0.25 steps, in column B.
The Beta card in F2 is 5. The green “Kaiser Weight” header sits above empty bordered cells in C2:C10.
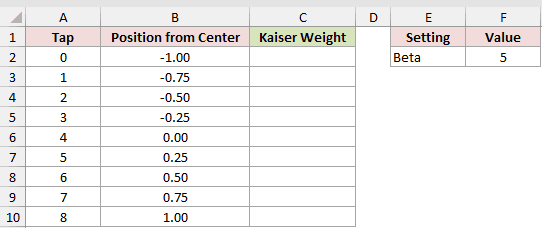
Column C should calculate a normalized Kaiser weight for every tap position.
Here is the formula entered in C2 and copied down:
=BESSELI($F$2*SQRT(1-B2^2),0)/BESSELI($F$2,0)
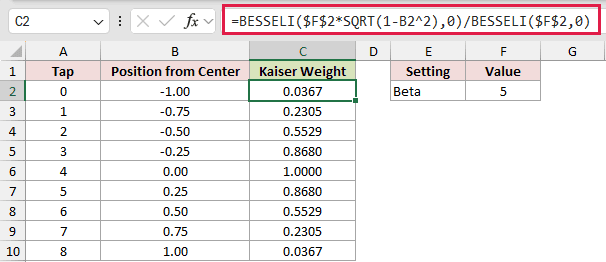
The numerator changes with the tap position. Dividing by BESSELI at beta normalizes the center weight to 1.0000.
The weights are symmetric around the center. Positions -0.50 and 0.50 both return 0.5529, while the two endpoints return 0.0367.
These smaller endpoint weights taper the sampled signal before filter or spectral analysis work.
Pro Tip: In the MathWorks kaiserord estimate, A is the stopband attenuation in dB. For A above 50, a common beta estimate is 0.1102*(A-8.7). At 60 dB, it returns about 5.653.
Example 6: Handle Unusual BESSELI Inputs
The last example checks several inputs that can produce surprising values or errors.
Below is the dataset. The screenshot places scenarios, x values, and orders in columns A:C. A green “Result” header sits above empty bordered cells in D2:D9.
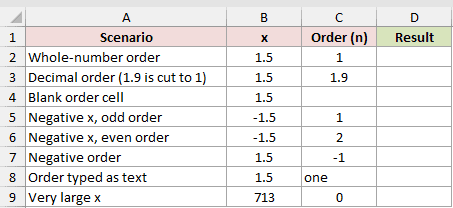
Column D should reveal how BESSELI handles each unusual x and order combination.
Here is the formula entered in D2 and copied down:
=BESSELI(B2,C2)
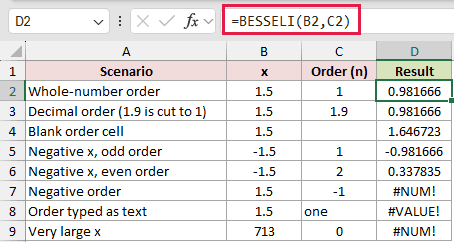
- The decimal order 1.9 is truncated to 1, so both rows return 0.981666.
- A blank order cell acts as 0 and returns 1.646723. Excel rejects
=BESSELI(1.5)when you type it without the n argument. - A negative x is accepted. Order 1 returns -0.981666, while order 2 returns 0.337835.
- A negative order returns #NUM!, and the text order
onereturns #VALUE!. - The x value 713 with order 0 returns #NUM! because Excel’s calculation overflows at an x this large.
Tips & Common Mistakes
- Use a nonnegative order. Any order below zero returns #NUM!.
- Remember that Excel truncates decimal orders. An order of 1.9 is treated as 1, not rounded to 2.
- Do not leave an order cell blank unless you intend to use order 0. The argument is still required in the formula.
- Numeric text can be coerced, but logical values and nonnumeric text return #VALUE!.
- Round Bessel results before testing equality. Excel’s Bessel calculations are accurate to roughly eight or nine significant digits.
- Very large positive x values can return #NUM! because Excel’s calculation overflows. In testing, x 700 works, while x 713 fails for order 0.
BESSELI can evaluate values and orders, normalize circular models, calculate goal-margin probabilities, and produce Kaiser window weights.
The examples also covered decimal orders, blank cells, negative inputs, text, and very large positive x values.
Other Excel articles you may also like:
