
The CONFIDENCE.T function in Excel returns a Student’s t-based margin of error for a population mean.
Subtract that margin from the sample mean for the lower confidence limit, and add it for the upper limit. It is not a prediction interval for an individual observation.
The margin depends on the confidence level, estimated spread, and sample size, so it helps compare how those choices affect uncertainty around the mean.
In this article, I’ll show you how to build a confidence interval, compare confidence levels and sample sizes, and contrast t-based and normal margins.
CONFIDENCE.T Function Syntax in Excel
Use CONFIDENCE.T to return a two-sided margin of error:
=CONFIDENCE.T(alpha,standard_dev,size)
alphais the required significance level. For example, 0.05 corresponds to 95% confidence.standard_devis the required population standard deviation, assumed to be known by Microsoft’s function reference.sizeis the required sample size.
When to Use CONFIDENCE.T Function
- Calculate a t-based margin of error for a population mean.
- Turn a sample mean and margin of error into lower and upper confidence limits.
- Compare how the selected confidence level changes the margin.
- Compare planning scenarios with different sample sizes.
Example 1: Build a T Confidence Interval
Let’s build a complete interval from one sample.
Below are cut-width measurements for 12 panels. The summary cells in D2:I2 calculate the sample statistics and confidence limits.
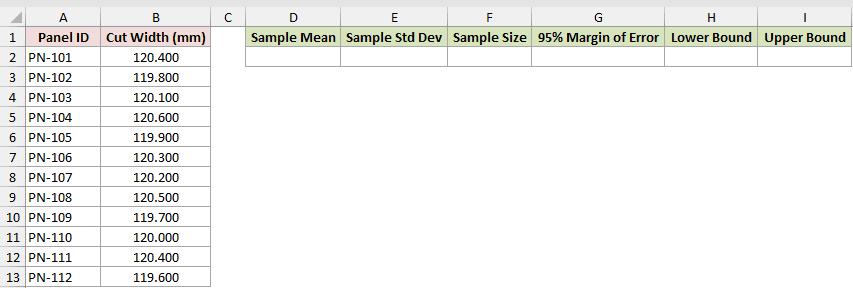
I want a 95% confidence interval for the population mean cut width, based on these 12 measurements.
Here is the sample-mean formula:
=AVERAGE(B2:B13)
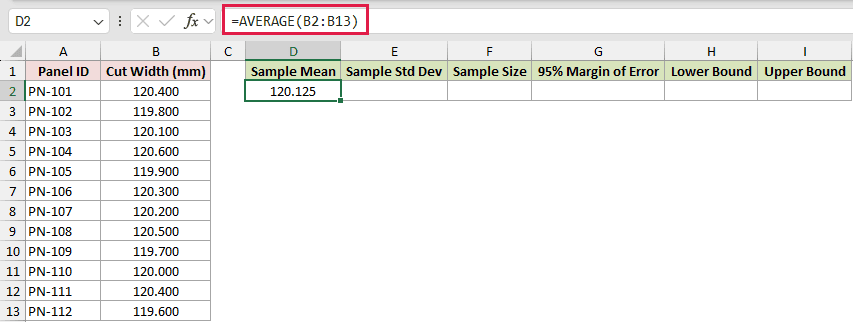
The sample mean is 120.125 mm. It is the center of the interval that we will build.
Here is the sample-standard-deviation formula:
=STDEV.S(B2:B13)
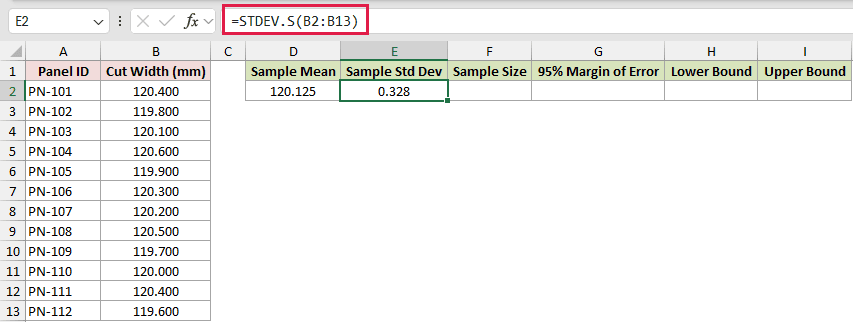
The sample standard deviation is 0.3278719262 mm. This workbook supplies it as a practical spread estimate to CONFIDENCE.T.
Microsoft describes the argument as a known population standard deviation. Using STDEV.S as a sample-based estimate is standard for a t interval when that population spread is unknown.
The interval still depends on the usual sampling and distribution assumptions. It does not prove that those assumptions hold for this data.
Here is the sample-size formula:
=COUNT(B2:B13)
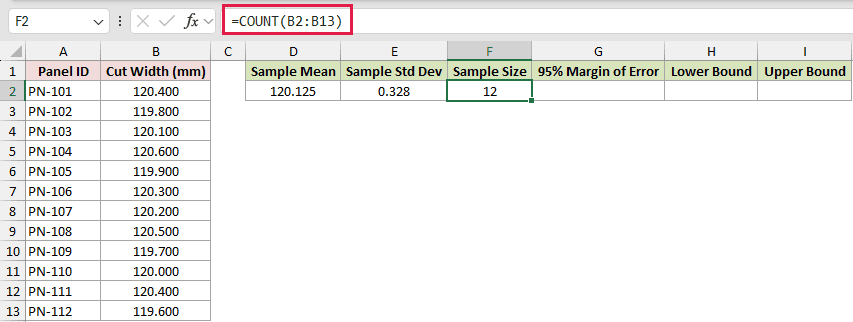
COUNT returns 12, which is the number of numeric panel measurements.
Here is the 95% margin-of-error formula:
=CONFIDENCE.T(0.05,E2,F2)
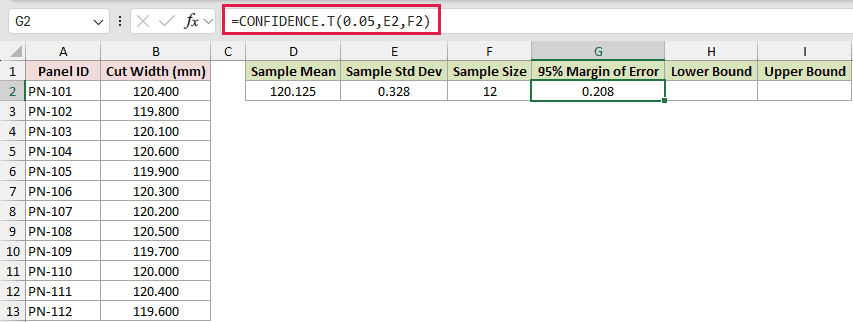
The result is 0.2083198832 mm. CONFIDENCE.T returns this margin of error, not the lower and upper bounds by itself.
Here is the lower-bound formula:
=D2-G2
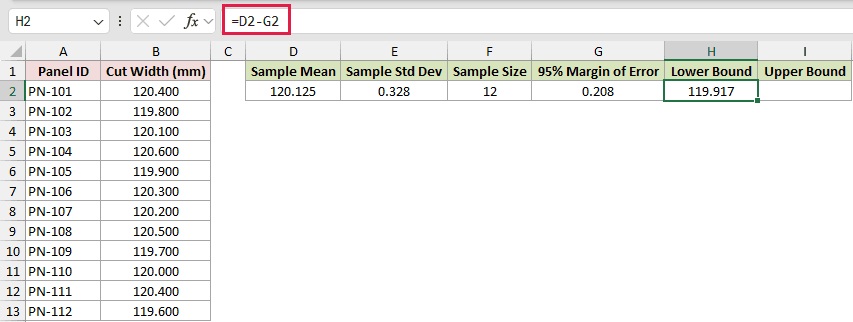
The lower bound is 119.9166801168 mm.
Here is the upper-bound formula:
=D2+G2
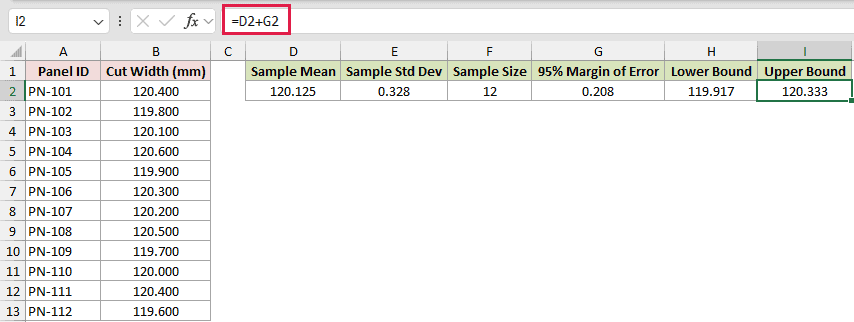
The upper bound is 120.3333198832 mm. The interval is therefore 120.125 mm plus or minus 0.2083198832 mm.
This interval concerns a population mean, not the width of one future panel. Its interpretation also depends on a suitable sampling process and the statistical model behind the calculation.
For a broader walkthrough, see how to calculate a confidence interval in Excel.
Example 2: Compare Confidence Levels
The chosen confidence level changes the width of the margin.
Below are 90%, 95%, and 99% scenarios. The sample standard deviation and sample size stay the same in every row.
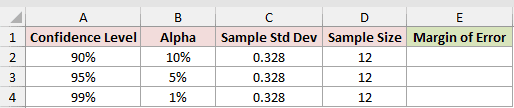
I want to compare t margins of error for the three confidence levels.
Here is the formula:
=CONFIDENCE.T(B2:B4,C2:C4,D2:D4)
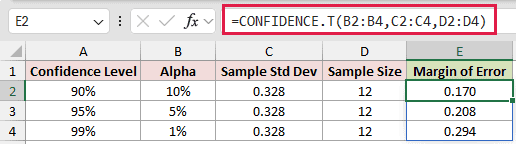
The formula spills margins of 0.1699777548, 0.2083198832, and 0.2939598424. They correspond to 90%, 95%, and 99% confidence.
The higher confidence level has the wider margin here. In the formula, that means a smaller alpha value produces a larger result when the other inputs stay fixed.
Example 3: Compare Sample-Size Scenarios
Sample size affects the margin in a different way.
Below are four sample-size scenarios with the same spread estimate and 95% confidence level. Column D is ready for the margins.
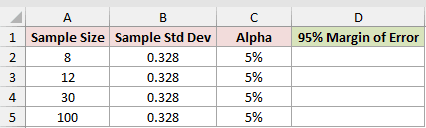
I want to see how the margin changes as the sample size increases.
Here is the formula:
=CONFIDENCE.T(C2:C5,B2:B5,A2:A5)
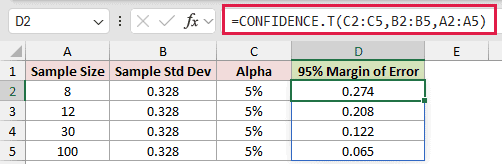
The spilled margins are 0.2741077899 for 8 measurements, 0.2083198832 for 12, 0.1224293893 for 30, and 0.0650569034 for 100.
With these inputs, larger samples produce narrower margins. That result depends on holding the spread estimate and confidence level fixed.
Example 4: Compare T and Normal Margins
T and normal margins use related inputs but different distributions.
Below is a small parameter card with alpha, standard deviation, and sample size. The last two rows calculate both margins.
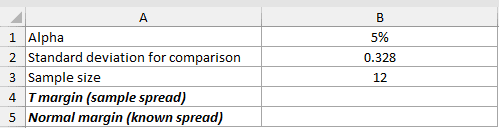
I want to compare the Student-t margin with the normal-distribution margin for the same illustrative inputs.
Here is the t-margin formula:
=CONFIDENCE.T(B1,B2,B3)
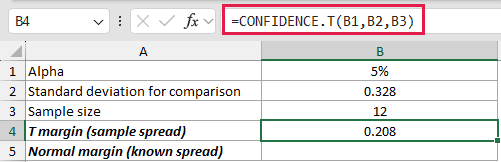
The t margin is 0.2083198832.
Here is the normal-margin formula:
=CONFIDENCE.NORM(B1,B2,B3)
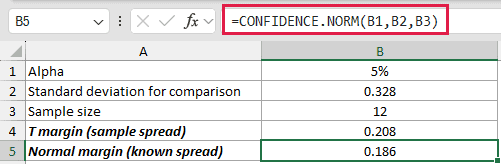
The normal margin is 0.1855075972, which is smaller for these inputs.
The smaller number does not make CONFIDENCE.NORM the automatic choice. Microsoft’s reference for both functions assumes a known population standard deviation, and the distribution choice should match the method you intend to use.
Tips & Common Mistakes
- CONFIDENCE.T returns a margin of error. Build limits by subtracting it from and adding it to the sample mean.
- Use alpha, not the confidence percentage. For 95% confidence, alpha is 0.05.
alphamust be greater than 0 and less than 1. Standard deviation must be positive.- A noninteger size is truncated by Excel. A size of 1 returns
#DIV/0!. - Do not interpret the interval as a range for an individual future observation. It is for a population mean.
- Use STDEV.S to estimate dispersion from a sample, and COUNT to count its numeric observations.
I have shown you how to build a t-based confidence interval and compare its margins across common scenarios.
I hope you found this article helpful.
Other Excel articles you may also like:
