
Excel’s CONFIDENCE.NORM function returns the margin of error for a confidence interval around a population mean when the population standard deviation is known.
The result is the interval’s half-width, not the complete interval. Subtract it from the sample mean for the lower bound and add it for the upper bound.
In this article, I’ll show you how to build an interval, plan a sample size, and compare normal and t margins.
CONFIDENCE.NORM Function Syntax in Excel
The function needs a significance level, a known population standard deviation, and a sample size.
=CONFIDENCE.NORM(alpha, standard_dev, size)
- alpha (required) is the significance level, so the confidence level is
100*(1 - alpha)%. An alpha of 0.05 means 95% confidence. - standard_dev (required) is the known population standard deviation.
- size (required) is the sample size.
When to Use CONFIDENCE.NORM Function
- Calculate the margin of error when the population standard deviation is known from reliable historical records.
- Build lower and upper confidence bounds around a sample mean.
- Compare how confidence levels and sample sizes change the margin of error.
- Estimate the sample size needed to meet a target margin.
- Calculate a one-sided bound for a population mean.
Example 1: Build a Normal Confidence Interval
Let’s start with a filling-line quality check for coffee bags.
Below is the dataset. It contains bag IDs, net weights, and a known process standard deviation, with labeled cells for the sample statistics, margin, and bounds.
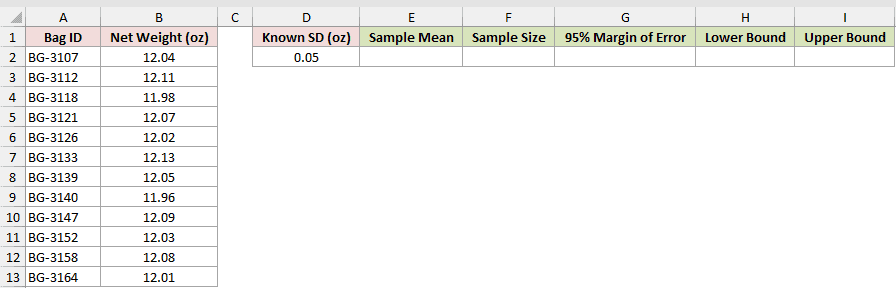
We want a 95% confidence interval for the population mean bag weight.
First, calculate the sample mean:
=AVERAGE(B2:B13)
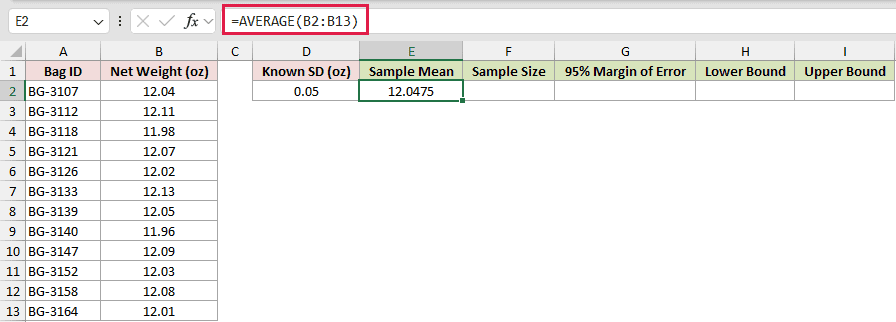
The sample mean is 12.0475 ounces.
Next, count the observations:
=COUNT(B2:B13)
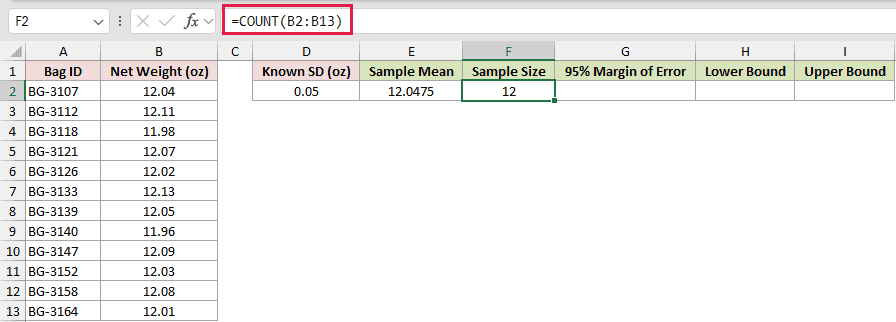
The sample contains 12 bags.
Now calculate the margin of error:
=CONFIDENCE.NORM(0.05,D2,F2)
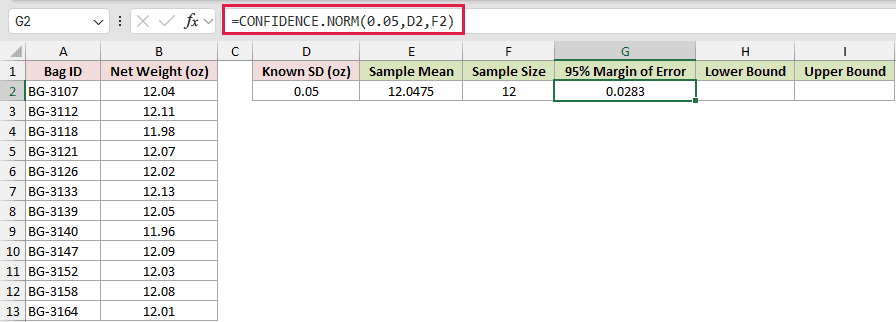
The function returns 0.0283 ounces. This is the half-width around the sample mean, not the full interval.
Subtract the margin from the mean for the lower bound:
=E2-G2
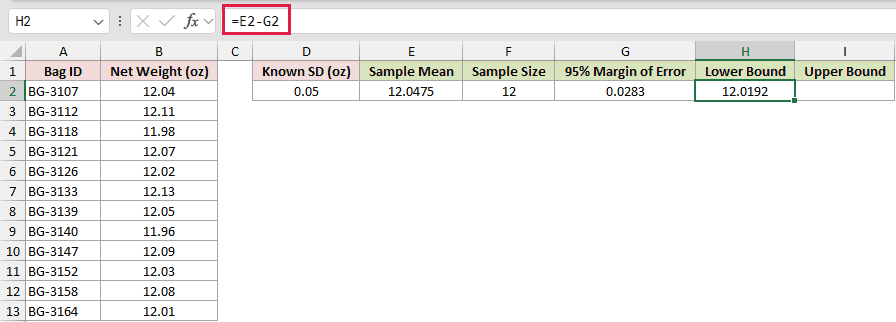
The lower bound is 12.0192 ounces.
Then add the margin to the mean for the upper bound:
=E2+G2
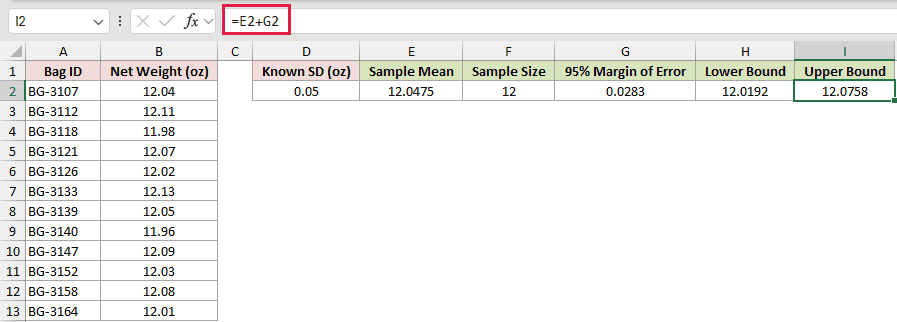
The upper bound is 12.0758 ounces. We are 95% confident that the population mean lies between these bounds.
The known standard deviation comes from long-run process records. It is not calculated from the small sample shown here.
Pro Tip: This interval estimates the population mean bag weight. It does not predict the weight of one future bag.
Example 2: Compare Confidence Levels
Now let’s see what changes when the requested confidence level increases.
Below is the dataset. It lists confidence levels, known standard deviations, and sample sizes, with a result column ready for each margin of error.
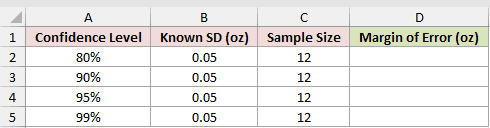
We want one formula to return a margin for every confidence level.
Here is the formula:
=CONFIDENCE.NORM(1-A2:A5,B2:B5,C2:C5)
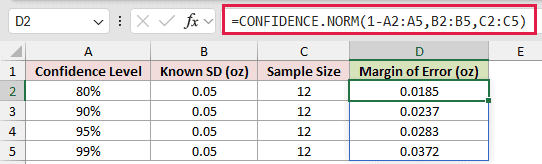
The formula converts each confidence level to alpha inside the function, then spills the results down column D.
The 80% level returns 0.0185 ounces, while the 99% level returns 0.0372 ounces. Higher confidence needs a wider margin when the other inputs stay fixed.
Range-based CONFIDENCE.NORM formulas spill in Excel 2021, Excel 2024 and Microsoft 365. Keep the cells below the formula clear so Excel can place every result.
Pro Tip: Alpha is not the confidence level. Typing 0.95 as alpha returned 0.000905 in testing, but that is the wrong answer for 95% confidence. Excel raises no error because 0.95 means a 5% confidence level.
Example 3: Find a Sample Size Target
Here’s a practical way to compare planned sample sizes before collecting data.
Below is the dataset. It lists proposed sample sizes and a known checkout-time standard deviation, with columns ready for the margins and target checks.
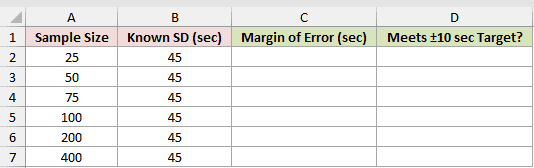
We want to find which sample sizes meet a margin target of ±10 seconds.
First, calculate the margin for every sample size:
=CONFIDENCE.NORM(0.05,B2:B7,A2:A7)
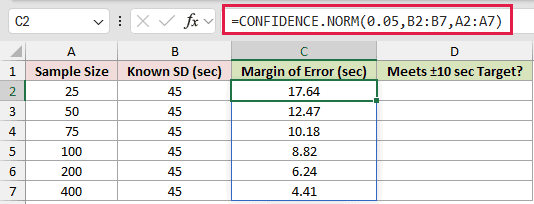
The spilling formula returns 17.64 seconds for a sample of 25 and 4.41 seconds for a sample of 400.
Next, test each margin against the target:
=C2:C7<=10
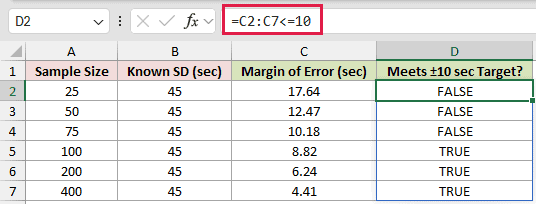
The sample size of 75 returns 10.18 seconds and FALSE. The sample size of 100 returns 8.82 seconds and TRUE.
A larger sample produces a smaller margin when the confidence level and standard deviation remain fixed.
Pro Tip: The smallest sample size for this ±10-second target is 78. It is the smallest size whose margin falls to 10 seconds or less.
Example 4: Compare Normal and T Margins
Next, let’s compare the normal margin with the t-based margin across several sample sizes.
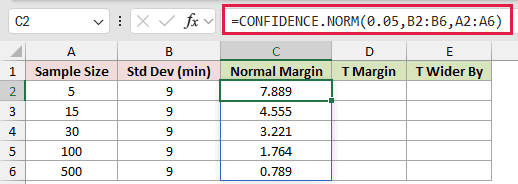
Below is the dataset. It contains sample sizes and a standard deviation, with result columns for the normal margin, t margin, and percentage gap.
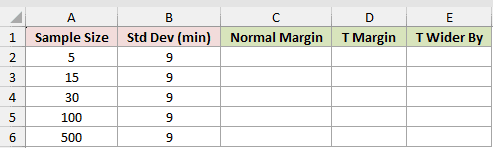
We want to see how quickly the normal and t margins move closer together.
First, calculate the normal margins:
=CONFIDENCE.NORM(0.05,B2:B6,A2:A6)
Now calculate the t margins for comparison:
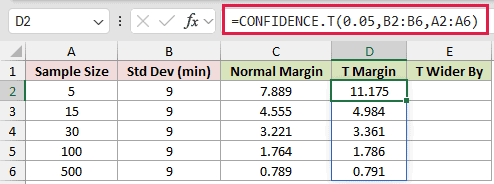
=CONFIDENCE.T(0.05,B2:B6,A2:A6)
Finally, calculate how much wider each t margin is:
=D2:D6/C2:C6-1
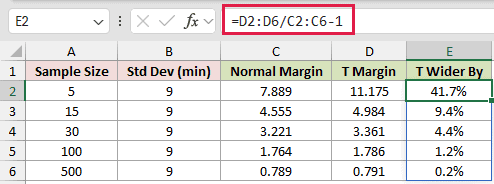
At a sample size of 5, the normal margin is 7.889 and the t margin is 11.175. The t margin is 41.7% wider.
At a sample size of 100, the margins are 1.764 and 1.786. The gap has narrowed to 1.2%.
Use CONFIDENCE.NORM when the population standard deviation is genuinely known. CONFIDENCE.T is the safer choice when a small sample supplies the estimated standard deviation.
Example 5: Build Intervals for Several Regions
Let’s apply the same calculation to a regional order summary.
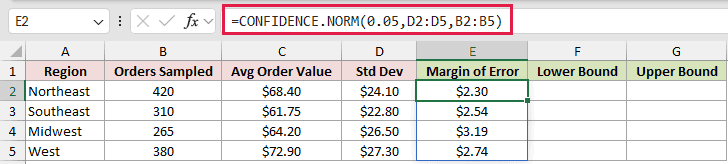
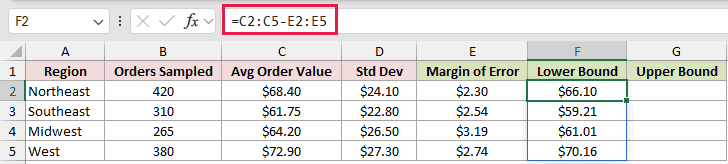
Below is the dataset. It lists each region’s sampled orders, average order value, and standard deviation, with result columns for the margin and both bounds.

We want to build a confidence interval for each region’s mean order value.
First, calculate the margins:
=CONFIDENCE.NORM(0.05,D2:D5,B2:B5)
Next, subtract each margin from its average for the lower bounds:
=C2:C5-E2:E5
Then add each margin for the upper bounds:
=C2:C5+E2:E5
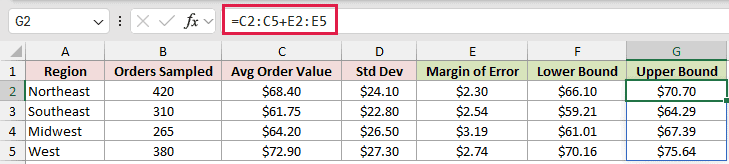
The Northeast interval runs from $66.10 to $70.70, while the Midwest interval runs from $61.01 to $67.39.
The Midwest margin is the widest at $3.19 because it combines the smallest sample with a relatively large standard deviation.
These standard deviations come from the samples, so this is a large-sample normal approximation.
Example 4 found gaps of only 1.2% at 100 and 0.2% at 500, showing the two margins barely differ across the 265 to 420-order range here.
Example 6: Calculate a One-Sided Lower Bound
Finally, let’s calculate a lower bound for mean earbud battery runtime.
Below is the parameter card. It contains the sample mean, known standard deviation, sample size, and alpha, with labeled cells ready for both margins and the lower bound.
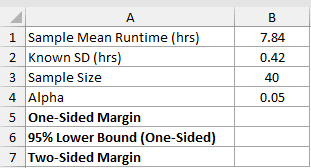
We want a 95% one-sided lower bound for the population mean runtime.
First, calculate the one-sided margin by doubling alpha:
=CONFIDENCE.NORM(2*B4,B2,B3)
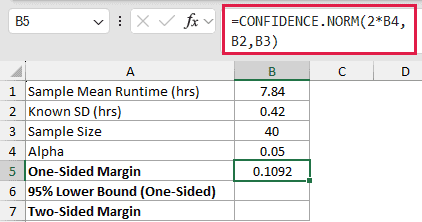
The one-sided margin is 0.1092 hours.
CONFIDENCE.NORM splits alpha across two tails. Passing 2*B4, or 0.10, leaves the full 0.05 in the lower tail, giving 95% one-sided confidence.
Now subtract that margin from the sample mean:
=B1-B5
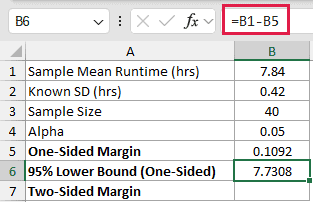
The lower bound is 7.7308 hours. We are 95% confident that the population mean runtime is at least 7.7308 hours.
For comparison, calculate the usual two-sided margin:
=CONFIDENCE.NORM(B4,B2,B3)
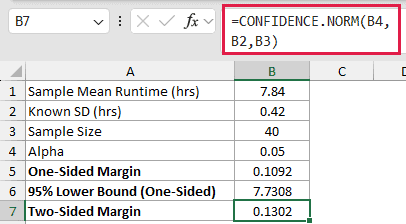
The two-sided margin is 0.1302 hours, wider than the one-sided margin.
Pro Tip: Say you are 95% confident in the lower bound. Do not describe it as a 95% chance that the population mean is above it.
Tips & Common Mistakes
- CONFIDENCE.NORM returns only the margin of error. You still need to subtract and add that margin when you want both interval bounds.
- Use a known population standard deviation. When the value is estimated from a small sample, use CONFIDENCE.T instead.
- Alpha is the significance level, not the confidence level. The
1-A2:A5conversion in Example 2 stops the confidence level from being typed in as alpha. - Size is truncated. In testing, 12.9 behaved like 12, while 0.5 returned #NUM!.
- A size of 1 is valid for CONFIDENCE.NORM. In testing,
=CONFIDENCE.NORM(0.05,1,1)returned 1.959964, while=CONFIDENCE.T(0.05,1,1)returned #DIV/0!. - Clear any cells blocking a spilled result. Otherwise, Excel returns #SPILL! instead of the margins.
- CONFIDENCE.NORM arrived in Excel 2010 as the replacement for CONFIDENCE. The older function remains for backward compatibility and uses the same normal-based calculation.
- A confidence interval estimates a population mean. It is not a prediction interval for one future observation.
I covered how to build an interval, compare confidence levels, and find the sample size for a target margin.
I also compared normal and t margins and calculated a one-sided lower bound.
I hope you found this article helpful.
Related Excel Functions / Articles:
