If you want to find out how to calculate a confidence interval in Excel, you’re in the right place!
Here, you can see how a confidence interval is calculated based on significance level, standard deviation, and sample size.
Confidence Interval Explanation
A confidence interval represents a set of values that possibly contain the true mean of a data range.
This is calculated based on a confidence value and the true mean of a population. A confidence value is actually a confidence interval of a data range.
It will be easier for you to understand if you see the following example.
Let’s say that you have a range of different call duration times with a mean of 50 and a standard deviation of 1.5%. In other words, the average call duration is 50 seconds, with a standard deviation of 1.5%
You can also take the significance level of 0.05%, which means that the significance level is 95% (in other words – if you have 100 repeated tests, the true mean is found in 95).
A confidence interval is an important statistical function, and you can find it often in various financial calculations. It can be a significant and important indicator for decision-makers.
How to Calculate Confidence Interval in Excel?
In order to find out a confidence interval, you have to use 3 functions:
- AVERAGE – to find the true mean;
- STDEV.P – to calculate the standard deviation;
- CONFIDENCE – to calculate the confidence value.
Excel AVERAGE Function
The AVERAGE function allows you to calculate the average (the true mean) value of a given data range.
This function has the following syntax:
=AVERAGE(range)
- range – for the range you can select the whole range (for example A1:A20) or select individual cells and separate them by comma (A1, A2, A3).
Excel STDEV.P Function
To calculate the standard deviation of a data range, you can use the STDEV.P function.
This function ignores all non-numeric values and considers only numbers in the calculation.
This function only takes one argument:
=STDEV.P(range)
- range – for the range you can select the whole range (for example A1:A20) or select individual cells and separate them by comma (A1, A2, A3).
Also read: Calculate the Coefficient of Variation in Excel
Excel CONFIDENCE Function
Using this function, you can calculate the confidence value which is necessary to get the confidence interval.
The function has the following arguments:
=CONFIDENCE(alpha, standard_dev, size)
- alpha – a significance level, that is between 0 and 1 (a percentage formatted as a decimal number);
- standard_dev – a standard deviation of a population for a data range;
- size – the population size.
You can also use new functions for the confidence calculation, but in this tutorial, we explained the old one, as it’s compatible with all versions of Excel.
In the newer version of Excel, you can find two more similar functions:
- CONFIDENCE.NORM – returns the confidence interval for a data range, using a normal distribution;
- CONFIDENCE.T – returns the confidence interval for a data range, using a Student’s T distribution.
Also read: How to Calculate Covariance in Excel?
Calculating the Confidence Interval in Excel
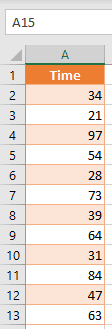
First, you need to populate the data range that will be used for the formula.
Let’s say that we have different times needed for completing the task in column A.
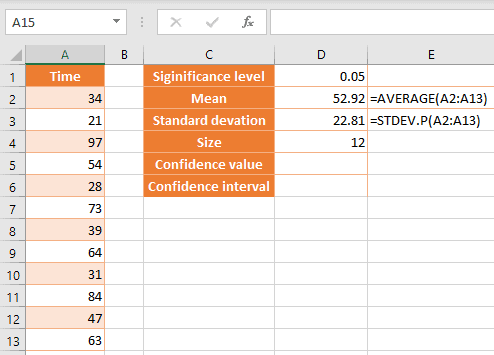
First, you have to populate the necessary parameters for the CONFIDENCE formula.
- In cell D2, enter the significance level (0.05)
- In D2, enter the formula for the true mean:
=AVERAGE(A2:A13)
- In cell D3, enter the formula for the standard deviation:
=STDEV.P(A2:A13)
- In D4, enter the size of the population (12).
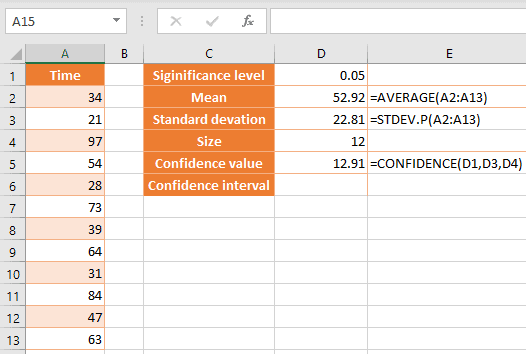
- Now you can calculate the confidence value – enter the following formula in D5:
=CONFIDENCE(D1,D3,D4)
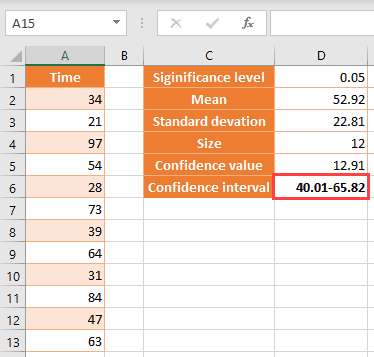
- With these inputs, you can easily get the confidence interval.
- The lower limit is mean – confidence value (52.92-12.91 = 40.01);
- The upper limit is mean + confidence value (52.92+12.91 = 65.82).
Things to Remember when Calculating Confidence Interval
Let’s briefly go once more through the key points for calculating the confidence interval in Excel.
- Your population (data set) for calculation shouldn’t have any blanks or zero values, because that will affect the calculation of the mean and standard deviation. The average value will be less than it is, since the 0 values will be counted in calculation.
Also, the standard deviation won’t be calculated correctly in case that you are using the old function (STDEV).
However, the new function (STDEV.P) ignores all blanks and zero values while calculating the standard deviation.
- A significance value must be a percentage formatted as a decimal number between 0 and 1 (usually this value is 5% – 0.05).
- The CONFIDENCE function returns a confidence value. Having in mind that you need to get a confidence interval, don’t forget to calculate the lower and upper limits.
You have to add a confidence limit to the mean in order to get the upper limit, and also to subtract it from the mean to get the lower limit.
Usual Errors in the Confidence Interval Function
While calculating the confidence interval using the Excel function, you can run into several kinds of errors:
- #VALUE! – this error happens if you provide non-numeric values to the function STDEV, when calculating the standard deviation. To avoid the error, use the new STDEV.P function, which ignores all non-numeric values;
- #NUM! – this error can occur in the CONFIDENCE function in several cases:
- If the alpha parameter is not between 0 and 1 (since it’s percentage);
- If the standard_dev parameter is less than less or equal to zero (it have to be a positive number greater than 0);
- If the size parameter is less than 1.
Be sure to format all values as decimal numbers or whole numbers, since the CONFIDENCE function expects only numeric values for all the parameters.
Also, other functions that you use in the calculation of the confidence interval work with numeric values.
If you provide non-numeric values for AVERAGE, you will not get an error as a result of the function, but the mean value won’t be calculated correctly.
Other articles you may also like:
- How to Calculate Standard Error in Excel (Step-by-Step)
- How to Find Percentile in Excel (PERCENTILE Function)
- How to Calculate Variance in Excel?
- How to Find Range in Excel
- How to Calculate Confidence Interval in Excel
- How to calculate the p-Value in Excel?
- How to Find Z-score in Excel?
- How to Calculate Percentage Differences in Excel
- How to Calculate Cumulative Percentages in Excel?
- How to Calculate the Interquartile Range in Excel
- How to Calculate Mean Squared Error (MSE) in Excel?
- Calculate CHI-SQUARE in Excel
- How to Find Critical Value in Excel