
The T.DIST function in Excel returns a Student’s t-distribution value for a given t statistic and number of degrees of freedom.
It can return either the cumulative left-tail probability or the probability density at that point.
In this article, I’ll show you how to calculate left-tail probabilities, distinguish probability from density, and convert results into right-tail and two-tailed probabilities.
T.DIST Function Syntax in Excel
The T.DIST function needs three arguments:
=T.DIST(x,deg_freedom,cumulative)
xis the t statistic where you want to evaluate the distribution. It can be negative, zero, or positive.deg_freedomis the number of degrees of freedom. Excel requires a value of at least 1.cumulativeis TRUE for the cumulative left-tail probability or FALSE for the probability density.
When to Use T.DIST Function
- Find the probability to the left of a t statistic.
- Return the height of a Student’s t-distribution curve at a given point.
- Compare t-distributions with different degrees of freedom.
- Explain how one-tailed and two-tailed probabilities relate to the left-tail CDF.
Example 1: Calculate Left-Tail Probabilities
This example finds the cumulative probability to the left of each load-test t statistic.
Below are seven test records and an empty Probability to the Left column.
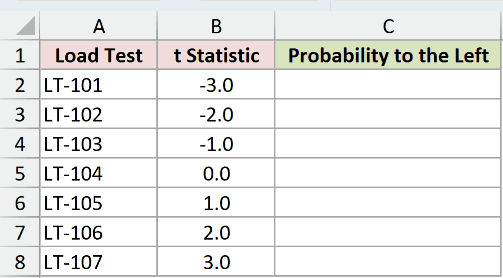
I want Excel to evaluate every t statistic using 12 degrees of freedom.
Here is the formula:
=T.DIST(B2:B8,12,TRUE)
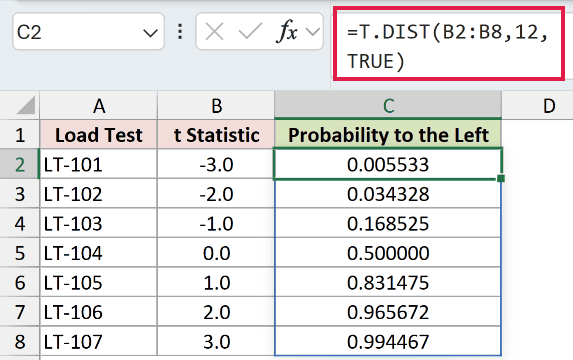
TRUE returns the cumulative distribution function. The results show the probability to the left of each value.
For -3, T.DIST returns 0.005533. For 0, it returns 0.500000 because the t-distribution is symmetric around zero.
Negative t statistics are valid. Keep their sign when you need the left-tail probability.
The formula spills seven results in Excel 2021, Excel 2024, Microsoft 365, and Excel for the web.
Pro Tip: Use TRUE when the question asks for the probability below or to the left of a t statistic.
Example 2: Compare Probability Density and Cumulative Probability
The cumulative argument changes what T.DIST calculates.
Below are seven sensor-deviation values with empty Density and Cumulative Probability columns.
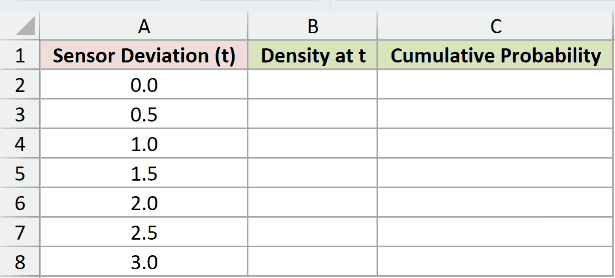
First, I want the probability density at each t value using 8 degrees of freedom.
Here is the density formula:
=T.DIST(A2:A8,8,FALSE)
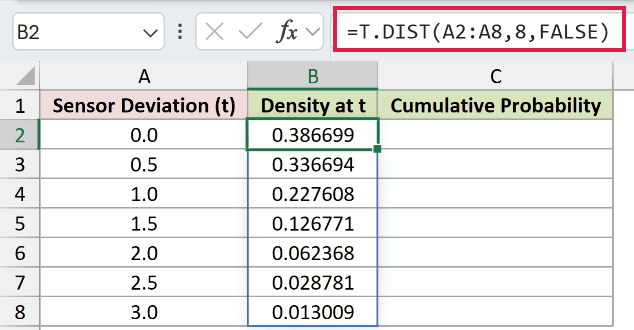
FALSE returns the curve height at each point. At t = 0, the density is 0.386699.
Next, I want the cumulative probability to the left of each value.
Here is the cumulative formula:
=T.DIST(A2:A8,8,TRUE)
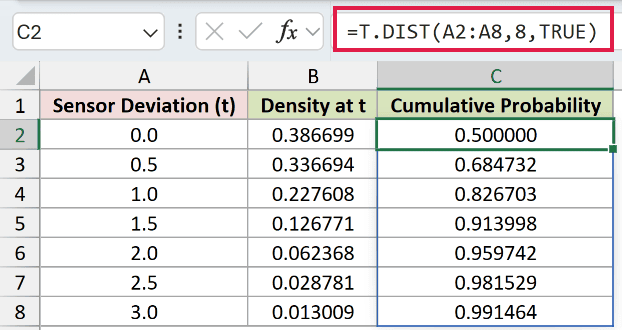
TRUE returns 0.500000 at t = 0 and 0.959742 at t = 2.
Density is not the probability of observing that exact value. For a continuous distribution, probabilities come from areas under the curve.
Pro Tip: Label density and cumulative probability clearly. Their values answer different questions even when they use the same t statistic.
Example 3: Compare Degrees of Freedom
Degrees of freedom change the shape of the t-distribution and the probability returned for a fixed t statistic.
Below are four degrees-of-freedom values and an empty CDF at t = 2 column.
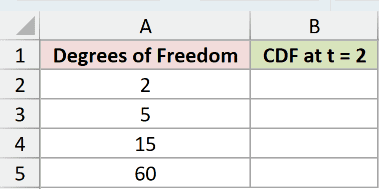
I want to hold the t statistic at 2 and compare the cumulative probability for each row.
Here is the formula:
=T.DIST(2,A2:A5,TRUE)
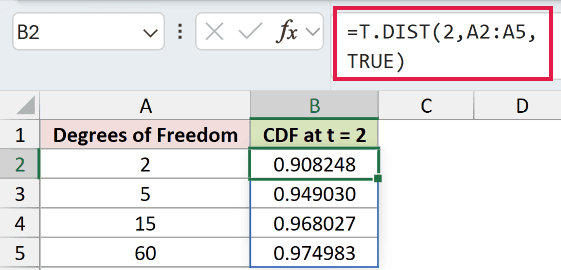
With 2 degrees of freedom, the result is 0.908248. With 60 degrees of freedom, it is 0.974983.
The probability rises because the t-distribution’s tails become lighter as degrees of freedom increase.
For a one-sample t statistic, degrees of freedom commonly equal the sample size minus one.
Example 4: Convert a Left-Tail CDF to a Right-Tail Probability
T.DIST returns a left-tail probability, but some tests ask for the probability to the right of a positive t statistic.
Below are an observed t statistic, degrees of freedom, and two empty probability cells.
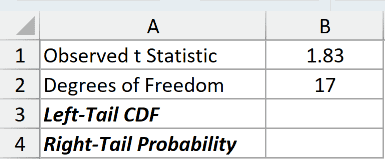
First, I want the cumulative probability to the left of 1.83.
Here is the formula:
=T.DIST(B1,B2,TRUE)
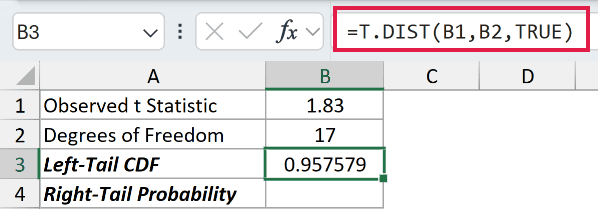
T.DIST returns 0.957579 in B3. This is the area to the left of the observed statistic.
The total area under the curve is 1, so I can subtract the left-tail result from 1.
Here is the right-tail formula:
=1-B3
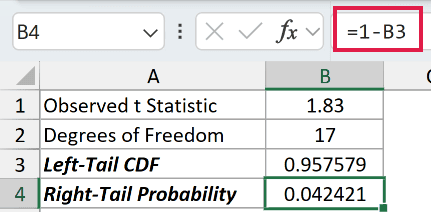
The right-tail probability is 0.042421. That is about 4.24%.
Use T.DIST.RT when the right-tail probability is your actual result. The subtraction here shows its relationship to T.DIST.
Pro Tip: Check which tail your hypothesis uses before interpreting a p-value. T.DIST always returns the left-tail CDF when cumulative is TRUE.
Example 5: Calculate a Two-Tailed Probability
A two-tailed test considers results at least as far from zero in either direction.
Below are a negative observed t statistic, 21 degrees of freedom, and two empty result cells.
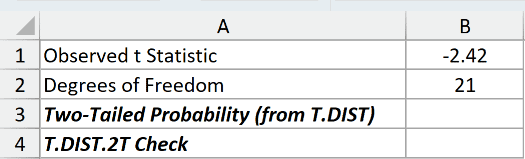
For this two-tailed calculation, I use the statistic’s magnitude, find the upper-tail area, and double it.
Here is the T.DIST formula:
=2*(1-T.DIST(ABS(B1),B2,TRUE))
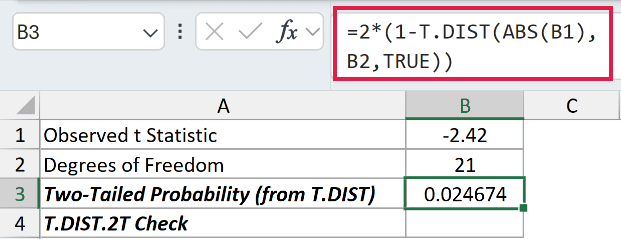
ABS changes -2.42 to 2.42 because a two-tailed test uses distance from zero. The formula returns 0.024674.
I can verify the result with Excel’s purpose-built two-tailed function.
Here is the check formula:
=T.DIST.2T(ABS(B1),B2)
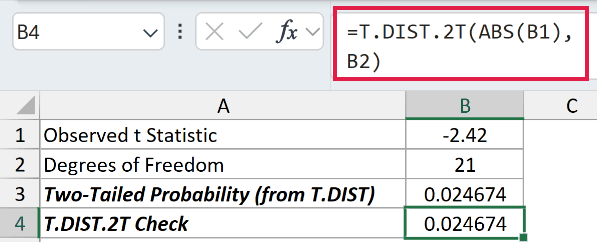
T.DIST.2T also returns 0.024674. Use it directly when a two-tailed probability is the required result.
Pro Tip: ABS belongs in this two-tailed calculation because the distance from zero matters. Do not remove a negative sign from a direct left-tail T.DIST calculation.
Tips & Common Mistakes
- Set
cumulativeto TRUE for a left-tail probability and FALSE for a density value. - Keep negative t statistics unchanged when calculating a direct left-tail CDF.
- Use T.DIST.RT for a right-tail probability and T.DIST.2T for a two-tailed probability.
- Use T.INV or T.INV.2T when you need a critical t value from a probability. This critical-value guide explains that inverse task.
- Excel 2019 and earlier need row formulas copied down instead of the spilling range formulas shown here.
- Nonnumeric arguments return
#VALUE!, and degrees of freedom below 1 return an error. - For interval estimates, see how confidence intervals work in Excel and when to use the CONFIDENCE.T function.
- A z-score calculation uses the standard normal distribution, while T.DIST uses Student’s t-distribution.
I covered left-tail probabilities, density values, degrees of freedom, and conversions for right-tailed and two-tailed tests.
I hope you found this article helpful.
Related Excel Functions / Articles:
