
If you want to know whether a difference between two groups would be unusual under a null hypothesis of equal population means, a t-test is one way to check.
Excel can run one for you in a few different ways.
Maybe you compared two groups, got different averages, and you’re not sure the gap actually means anything. That’s exactly the question a t-test answers.
In this tutorial, I’ll show you three ways to run a t-test in Excel: the Data Analysis ToolPak, the T.TEST function, and building it by hand with T.DIST.
I’ll also explain how to read the p-value so you know what the result is telling you.
Method #1: Using the Data Analysis ToolPak
The Data Analysis ToolPak is the fastest route when you want the full picture.
You pick your test type, point it at your two columns, and Excel hands back a complete stats table with the t-statistic and the p-value already worked out.
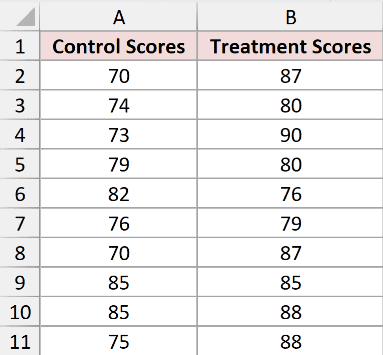
Below I have the test scores of two separate groups of students in columns A and B.
The control group was taught with the usual method, and the treatment group is a different set of students who tried a new method.
The columns are independent groups, not matched pairs, so the rows do not represent the same students. A two-sample t-test also assumes independent observations and roughly normal scores.
Investigate any obvious outliers before running the test, but do not remove a score automatically just because it looks extreme.
Confirm whether it is a data error or a valid observation first.
I want to know whether the observed difference would be unusual if the two population means were equal.
The ToolPak gives you three t-test variants.
Pick Paired Two Sample for Means when the same people are measured twice, like a before-and-after test.
Pick a two-sample option when the groups are different people, like ours.
For this demonstration, I will explicitly assume the two population variances are equal and use Equal Variances. Similar-looking sample spreads alone do not prove that assumption.
If equal variance is not justified, choose Unequal Variances instead. That option runs Welch’s two-sample t-test and does not pool the two sample variances.
If you don’t see Data Analysis on the Data tab, the add-in isn’t switched on yet. Here’s how to turn it on:
- Go to File > Options > Add-ins. In the Manage box at the bottom, choose Excel Add-ins and click Go. Tick Analysis ToolPak and click OK.
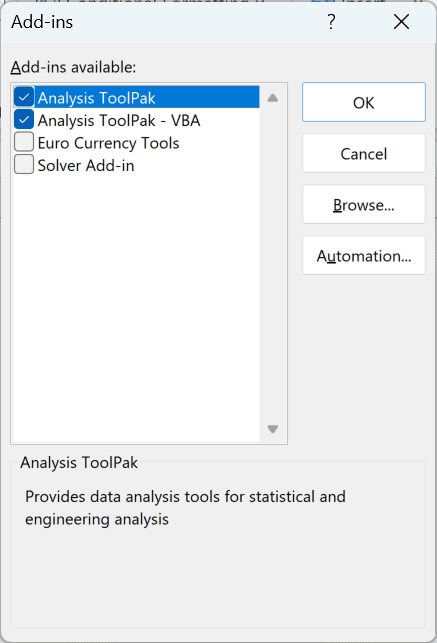
Those are the Windows steps. On a Mac, choose Tools > Excel Add-ins, select Analysis ToolPak, and click OK.
The Analysis ToolPak is available in desktop Excel for Windows and Mac.
Excel for the web does not provide the ToolPak command, so use a worksheet formula such as T.TEST there.
Once it’s on, here are the steps to run the t-test:
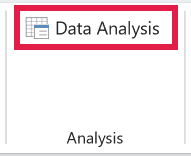
- On the Data tab, click Data Analysis on the far right.
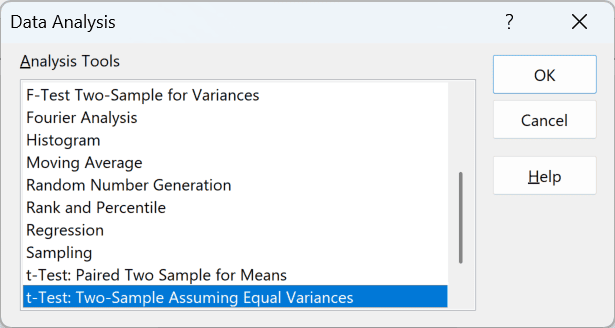
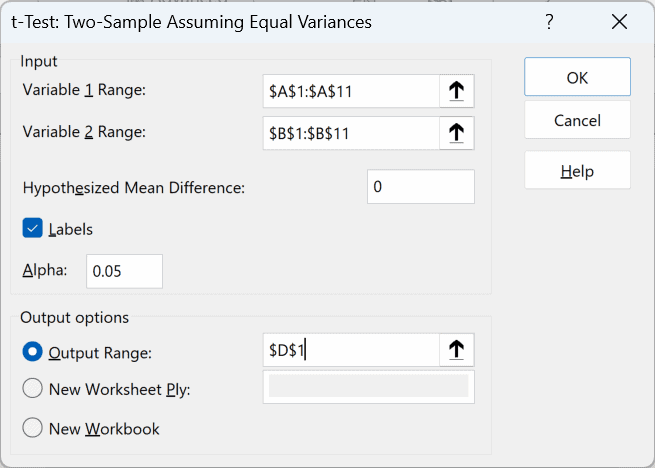
- Select “t-Test: Two-Sample Assuming Equal Variances” from the list and click OK.
- Set Variable 1 Range to the control scores (A1:A11) and Variable 2 Range to the treatment scores (B1:B11). Tick Labels since row 1 has headers, leave Hypothesized Mean Difference at 0, keep Alpha at 0.05, choose an Output Range that doesn’t overlap your data, and click OK.
Excel drops a full results table onto the sheet. The row to focus on is P(T<=t) two-tail, which is the two-tailed p-value.
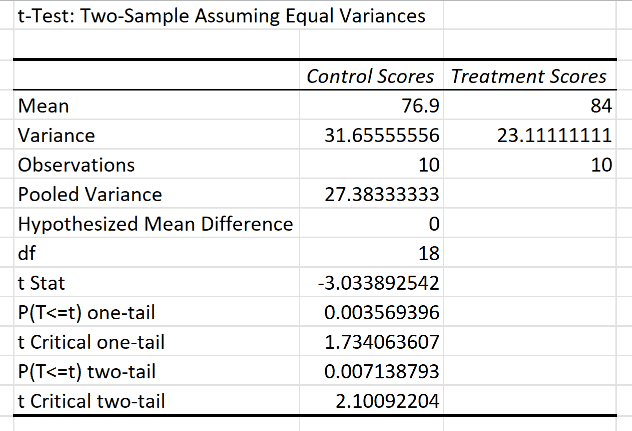
Here the p-value is about 0.0071.
The observed result would be unusual under the null hypothesis of equal population means, so I reject that null at the 0.05 level.
The t-test alone does not prove that the teaching method caused the difference.
The table also lists the Hypothesized Mean Difference, the t Stat, the degrees of freedom, and the critical values.
The t Stat is negative (-3.03) here only because the control group is Variable 1 and has the lower average.
Note: Use a one-tailed test only when you set the direction in advance. With Variable 1 as control and Variable 2 as treatment, treatment > control is the left-tail alternative because the statistic uses control minus treatment. Check that the treatment mean is actually higher before treating the one-tail value as evidence for that alternative.
Method #2: Using the T.TEST Function
If all you want is the p-value and not the full table, the T.TEST function gives it to you in a single cell.
There’s no dialog box, and it recalculates the moment your data changes.
I’ll use the same two groups of student scores, control in column A and treatment in column B.
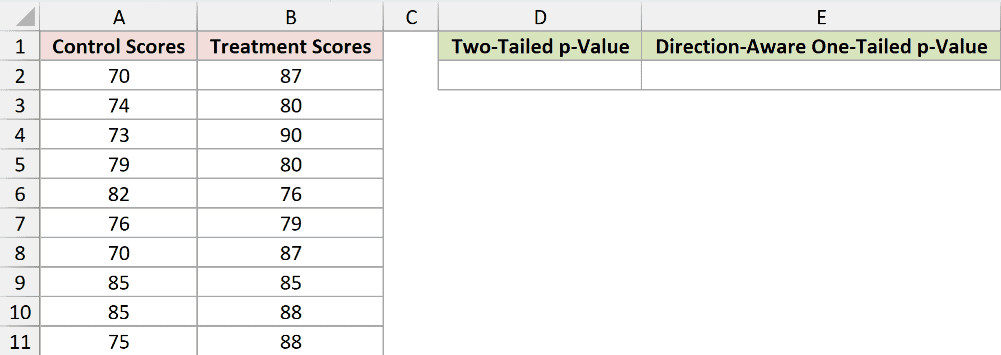
Here is the formula:
=T.TEST(A2:A11,B2:B11,2,2)
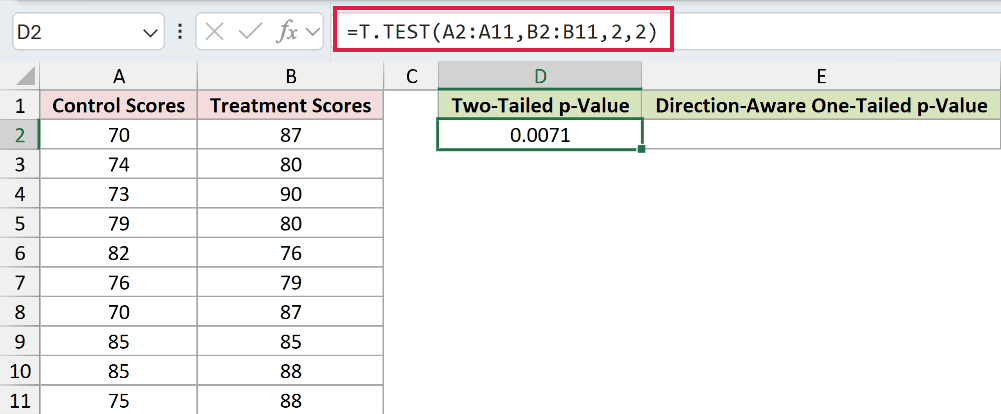
How does this formula work?
T.TEST takes four arguments: array1, array2, tails, and type.
The first two are the ranges holding your two groups, so A2:A11 is the control scores and B2:B11 is the treatment scores.
The tails argument is 1 for a one-tailed test or 2 for a two-tailed test.
I used 2 because I want to know if the scores differ at all, in either direction.
The type argument sets the test: 1 for paired, 2 for two-sample equal variance, and 3 for two-sample unequal variance.
I used type 2 only to continue the explicit equal-variance demonstration. If that assumption is not justified, use type 3 for Welch’s unequal-variance test.
The formula returns about 0.0071, the same two-tailed p-value as the ToolPak. This means the observed result would be unusual under the equal-means null hypothesis at the 0.05 level.
Suppose I set the alternative treatment > control before looking at the data. A one-tail T.TEST result alone does not encode that direction.
Excel computes a nonnegative statistic for T.TEST, so tails=1 returns the observed-direction half of the two-tailed probability. This formula also checks the observed mean direction:
=IF(AVERAGE(B2:B11)>=AVERAGE(A2:A11),T.TEST(A2:A11,B2:B11,1,2),1-T.TEST(A2:A11,B2:B11,1,2))
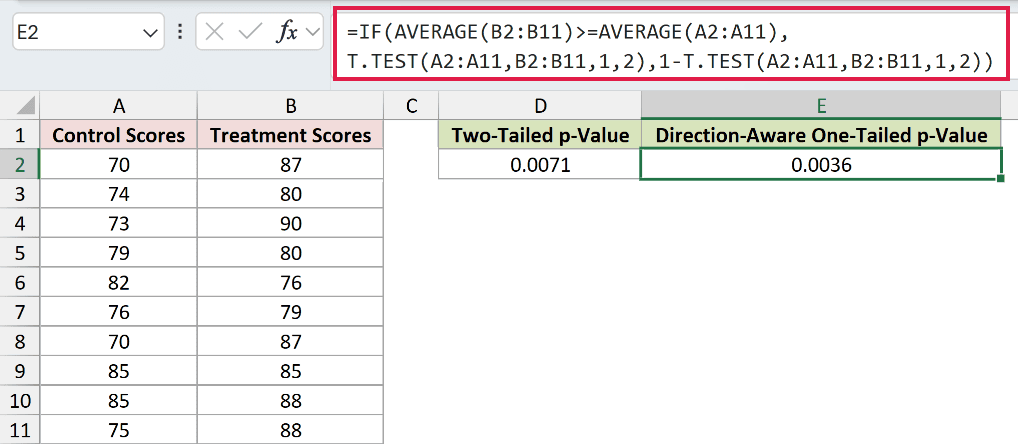
The treatment mean is 84.0 and the control mean is 76.9, so the formula returns about 0.0036. The observed direction matches the alternative.
If the treatment mean were lower, the IF would return the large complement instead of a small observed-direction value.
Only use a directional test when you set the alternative before looking at the data.
Note: Set the type argument to 1 only when the same people were measured twice, like a before-and-after test. Our two groups are different students, so type 2 (or type 3 for unequal variances) is the right choice.
Method #3: Using the T.DIST Function
The T.TEST function hides the math. If you’d rather see what’s actually happening, you can build the test yourself: calculate the t-statistic, then turn it into a p-value with T.DIST.
I’m working with the same control and treatment scores in columns A and B.
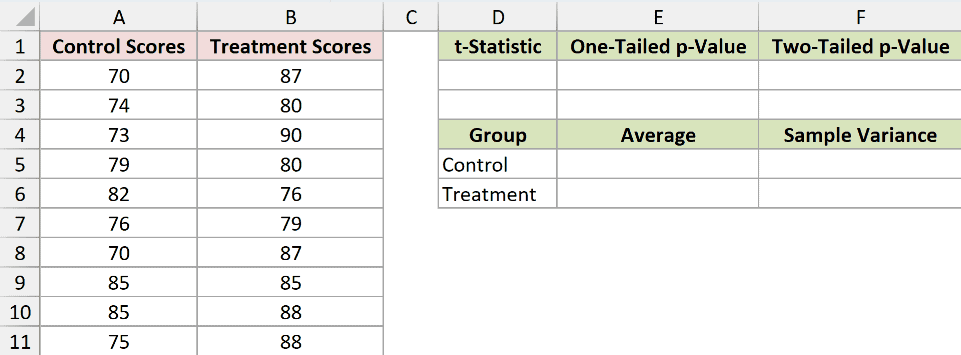
To keep the calculation easy to follow, I first pull out the pieces I need: the average and the sample variance for each group.
I use AVERAGE and VAR.S in a few helper cells.
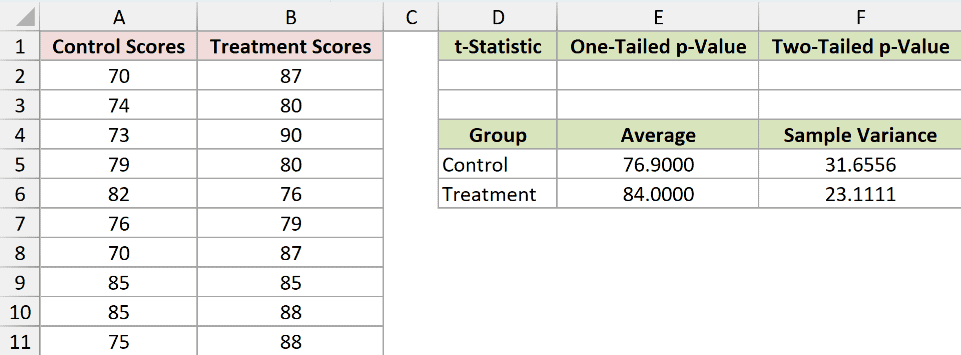
The control mean is 76.9 with sample variance 31.6556. The treatment mean is 84.0 with sample variance 23.1111. Under the equal-variance demonstration assumption, the pooled variance is 27.3833.
Now I’ll work out the t-statistic. It’s the difference between the two averages divided by the standard error of that difference. I’ll put it in cell D2:
=(AVERAGE(A2:A11)-AVERAGE(B2:B11))/SQRT((((COUNT(A2:A11)-1)*VAR.S(A2:A11)+(COUNT(B2:B11)-1)*VAR.S(B2:B11))/(COUNT(A2:A11)+COUNT(B2:B11)-2))*(1/COUNT(A2:A11)+1/COUNT(B2:B11)))
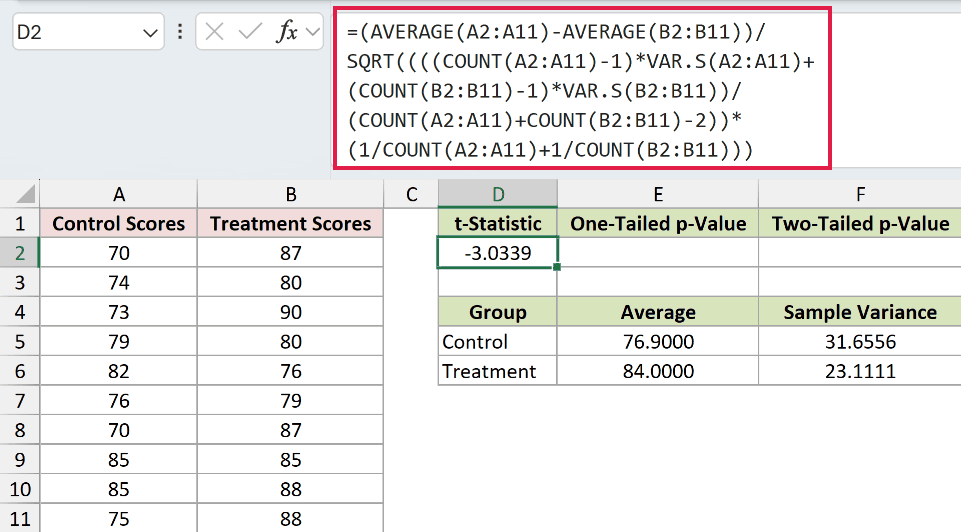
That gives a t-statistic of about -3.03. With 10 values in each group, the degrees of freedom is 10 + 10 – 2 = 18.
Because D2 is control minus treatment and the pre-specified alternative is treatment > control, evidence for that alternative falls in the left tail. T.DIST with TRUE returns that left-tail probability:
=T.DIST(D2,18,TRUE)
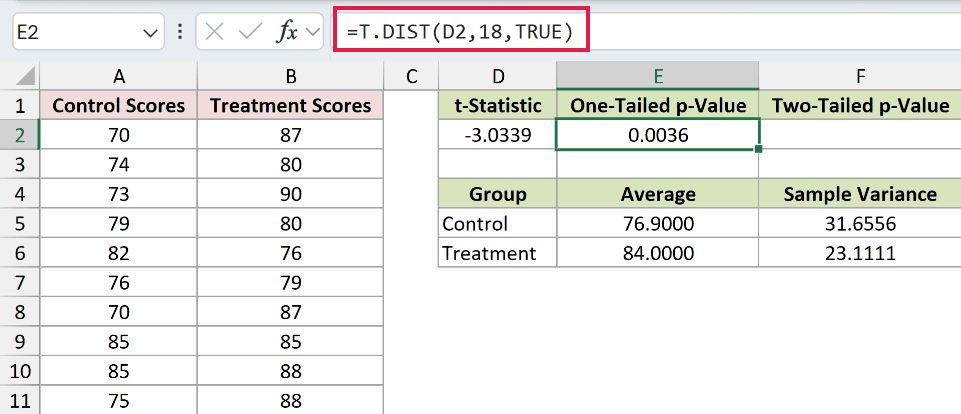
The result is about 0.0036. I keep this same left-tail formula whether D2 is negative or positive.
A positive D2 would return a large value, correctly showing that the observed direction does not support treatment > control. For a two-tailed test, use the absolute statistic with T.DIST.2T:
=T.DIST.2T(ABS(D2),18)
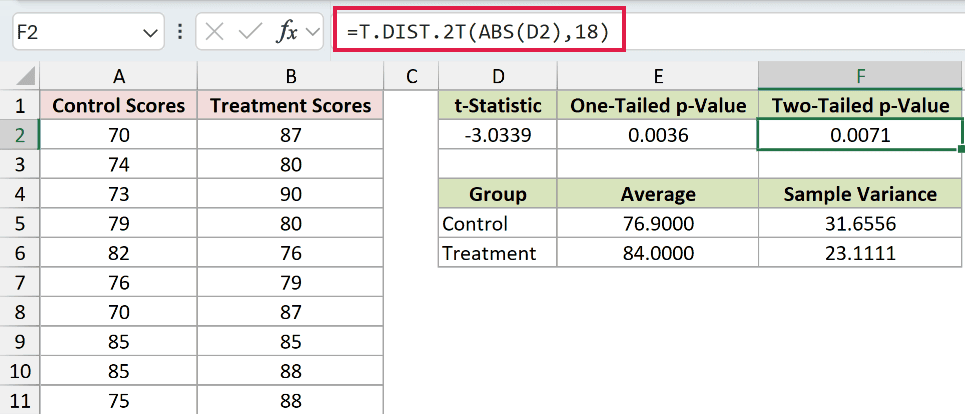
This lands at 0.0071, matching both earlier methods. Seeing the pieces makes it clear that the p-value comes from the tail area beyond the t-statistic you calculated.
Note: Choose the tail from the pre-specified alternative and the order used to subtract the means, not from the sign of the observed t-statistic. For control minus treatment with treatment > control, keep T.DIST for the left tail. T.DIST.2T requires a nonnegative input, which is why the two-tailed formula uses ABS(D2).
Additional Notes About Running a T-Test in Excel
- A t-test compares averages of numeric data. For categorical counts like pass/fail or yes/no, you want a chi-square test, not a t-test.
- The equal-variance test in this article is an explicit demonstration assumption. When equal variance is not justified, use the unequal-variance Welch test (type 3) instead.
- A small p-value means the observed result would be unusual under the null hypothesis. It does not tell you that the effect is large, so check the actual difference in means too.
- T.TEST returns only the p-value. If you also need the t-statistic, degrees of freedom, or critical values, use the ToolPak or build them with T.DIST.
- If you already have a t-statistic and just want the number, you can drop it into SpreadsheetPlanet’s P-Value Calculator instead of writing a formula.
Frequently Asked Questions
Which type of t-test should I use in Excel?
Use a paired test when the same subjects are measured twice. For independent groups, use the equal-variance test only when that assumption is justified. Otherwise, use Welch’s unequal-variance test.
What does the p-value from a t-test actually tell me?
It is the probability, assuming equal population means, of obtaining data that produce a result at least as extreme as the one observed.
A small p-value means that result would be unusual under the null, but it does not measure effect size or prove causation.
Can I run a t-test in Excel without the ToolPak add-in?
Yes.
Both T.TEST and T.DIST are built-in worksheet functions that need no add-in.
You only need the ToolPak if you want the full output table with the t-statistic, degrees of freedom, and critical values laid out for you.
Conclusion
I’ve covered three ways to run a t-test in Excel and how to match the tail and variance assumption to the question you planned to test.
I hope you found this article helpful!
Other Excel articles you may also like:
