
If you know a probability and need the matching value from a normal distribution, the NORM.INV function can calculate that cutoff.
In this article, I will show you how to find percentiles, service-level targets, central ranges, and sample-based estimates.
In Excel 2021 and later, you can feed NORM.INV a range of probabilities, and the results will spill into neighboring cells.
NORM.INV Function Syntax in Excel
The NORM.INV function uses the following syntax:
=NORM.INV(probability,mean,standard_dev)
probabilityis required. It must be greater than 0 and less than 1.meanis required. It is the arithmetic mean of the distribution.standard_devis required. It is the positive standard deviation of the distribution.
When to Use NORM.INV Function
- Convert a percentile or cumulative probability into a value from a normal distribution.
- Set an operational threshold for a target service level.
- Find the lower and upper bounds of a central normal range.
- Convert a standard normal z score into a value with a specified mean and standard deviation.
- Estimate a percentile using a sample mean and sample standard deviation.
Example 1: Spill Several Service-Time Percentiles
Let’s start with several service-time percentiles.
Below are the 50th, 80th, 90th, and 95th percentiles. The response-time model has a mean of 24 minutes and standard deviation of 6 minutes.
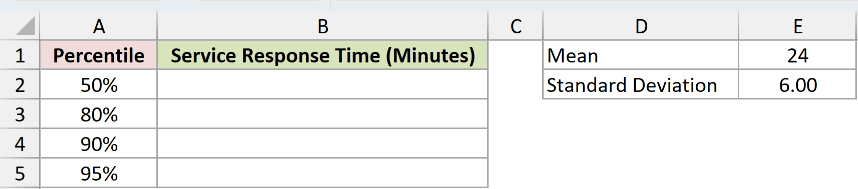
I want the response-time cutoff for each listed percentile.
Enter this formula in cell B2:
=NORM.INV(A2:A5,$E$1,$E$2)
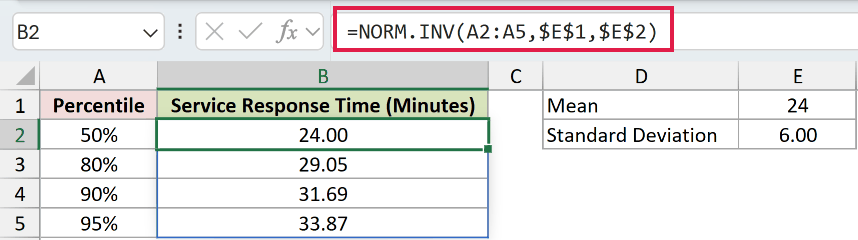
The probability argument is A2:A5, so Excel evaluates all four percentiles. The absolute references keep the mean and standard deviation fixed.
The results are 24.00, 29.05, 31.69, and 33.87 minutes. For example, the model places 90% of response times at or below 31.69 minutes.
Pro Tip: The spill range B2:B5 must be empty before you enter the formula. A blocked output cell causes a #SPILL! error.
Example 2: Stock for a Target Service Level
NORM.INV can turn a service-level target into a demand threshold.
Below is a 99% target service level, a mean weekly demand of 150 units, and a standard deviation of 20 units.
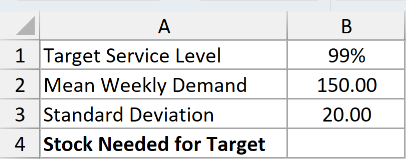
I want the demand level that covers 99% of weeks under this normal model.
Enter this formula in cell B4:
=NORM.INV(B1,B2,B3)
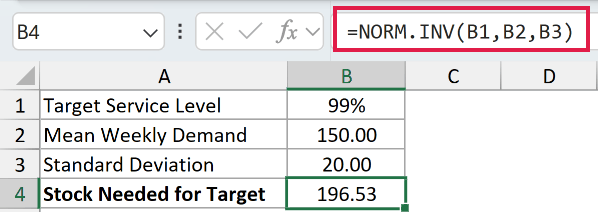
NORM.INV finds the x value whose cumulative probability is 99%. The result is 196.53 units.
If stock must be a whole number, round that threshold up to 197 units. Rounding down would move the target below the 99th-percentile estimate.
This calculation assumes weekly demand follows the stated normal distribution. A full reorder-point model may also need lead time and its variability.
Example 3: Build a Central 90% Range
A central 90% range leaves 5% in each tail of the distribution.
Below are tail probabilities of 5% and 95%, with a process mean of 50 and standard deviation of 8.

I want the lower and upper process readings that contain the middle 90% of the model.
Enter this formula in cell B2:
=NORM.INV(A2:A3,$E$1,$E$2)
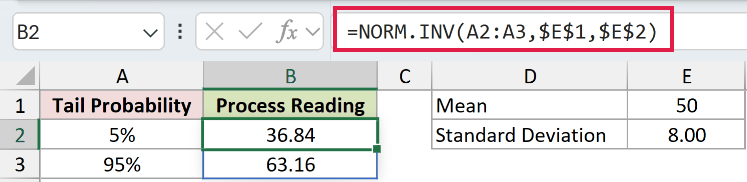
The formula spills 36.84 for the 5th percentile and 63.16 for the 95th percentile.
Under the normal model, 90% of readings fall between those two values. The remaining 10% is split equally between the two tails.
Example 4: Match NORM.INV to NORM.S.INV
NORM.S.INV is the direct function for the standard normal distribution.
Below is a probability of 97.5%, along with a mean of 10 and standard deviation of 2.
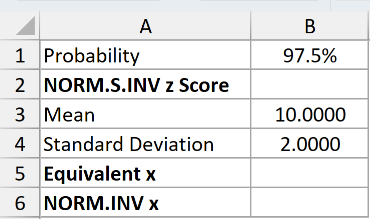
I want to confirm that scaling the standard normal result gives the same x value as NORM.INV.
First, enter this formula in cell B2:
=NORM.S.INV(B1)
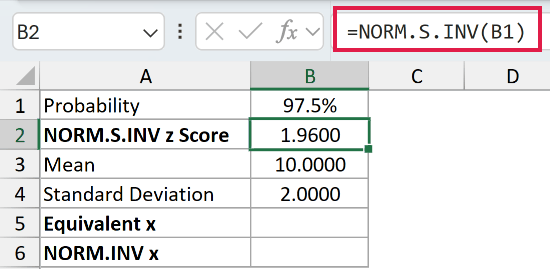
NORM.S.INV returns a z score of 1.9600.
Next, enter this scaling formula in cell B5:
=B3+B2*B4
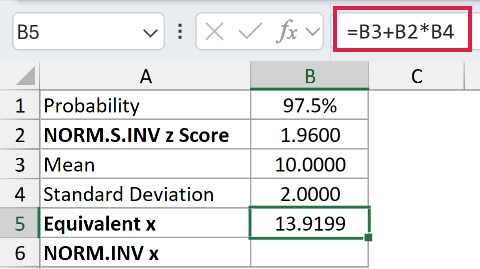
The formula multiplies the z score by the standard deviation and adds the mean. The result is 13.9199.
Finally, enter this NORM.INV formula in cell B6:
=NORM.INV(B1,B3,B4)
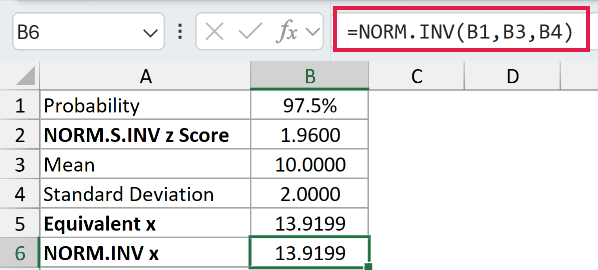
NORM.INV returns the same 13.9199 result. It performs the standardization and scaling in one function.
Example 5: Estimate a Percentile From a Sample
You can estimate the distribution parameters directly from sample data.
Below are turnaround times for eight work orders. Cell B11 contains the 90th percentile.
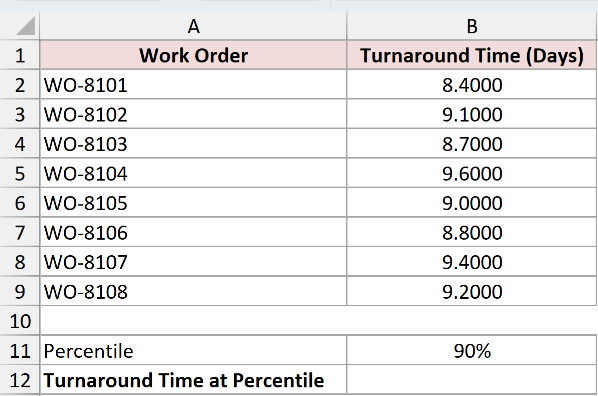
I want to estimate the 90th-percentile turnaround time under a fitted normal model.
Enter this formula in cell B12:
=NORM.INV(B11,AVERAGE(B2:B9),STDEV.S(B2:B9))
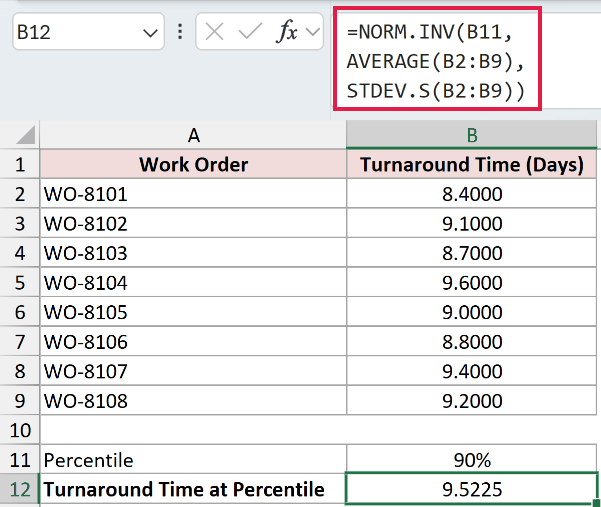
AVERAGE calculates a sample mean of 9.0250 days. STDEV.S calculates a sample standard deviation of about 0.3882 days.
NORM.INV uses those estimates and returns 9.5225 days for the 90th percentile.
This is a smooth model estimate. If the sample is not reasonably normal, the result may not describe the real turnaround-time distribution well.
To find the percentile directly from the observed values, use the PERCENTILE.INC function with =PERCENTILE.INC(B2:B9,B11). That empirical result can differ from the normal-model estimate.
Tips & Common Mistakes
- Keep
probabilitystrictly between 0 and 1. A value of 0 or 1 causes a #NUM! error. - Keep
standard_devgreater than zero. A zero or negative value also causes a #NUM! error. - Use NORM.S.INV when you need a z score from the standard normal distribution.
- Use NORM.DIST for the reverse question: supply x and return its cumulative probability or density.
- In Excel 2019 or earlier, range-based NORM.INV formulas do not spill. Enter one formula per row or use a legacy array formula.
- Treat NORM.INV results as model-based percentiles. Use PERCENTILE.INC when you want a percentile calculated from the observed values themselves.
I covered spilled percentiles, service-level targets, central ranges, standard normal conversions, and estimates from sample data.
I hope you found this article helpful.
