
The NORM.DIST function in Excel returns either a cumulative probability or a probability density for a normal distribution.
You specify the value, mean, standard deviation, and which result you need. Cumulative probability measures the area below the value; density describes the curve’s height there.
Subtracting cumulative probabilities at two limits gives the probability between them. A density value by itself is not that probability.
In this article, I’ll show you how to calculate probabilities below or between limits, distinguish probability from density, and use sample data to estimate probabilities.
NORM.DIST Function Syntax in Excel
The NORM.DIST function uses the following syntax:
=NORM.DIST(x,mean,standard_dev,cumulative)
xis required. It is the value at which you want to evaluate the distribution.meanis required. It is the arithmetic mean of the distribution.standard_devis required. It is the positive standard deviation of the distribution.cumulativeis required. Use TRUE for the cumulative probability at or below x, or FALSE for the probability density at x.
When to Use NORM.DIST Function
- Find the probability that a normally distributed value is at or below a limit.
- Calculate the probability that a value falls between two limits.
- Create cumulative-distribution or bell-curve data across several x values.
- Compare a normal distribution with a specified mean and standard deviation to the standard normal distribution.
- Estimate probabilities using a sample mean and sample standard deviation.
Example 1: Spill Probabilities for Several Limits
Let’s start with several delivery-time limits.
Below are four delivery limits, plus a mean delivery time of 36 minutes and a standard deviation of 4 minutes.

I want the probability that a delivery takes no more than each listed limit.
Enter this formula in cell B2:
=NORM.DIST(A2:A5,$E$1,$E$2,TRUE)
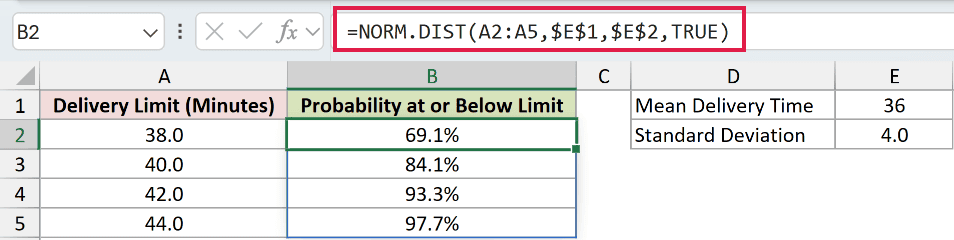
The x argument is A2:A5, so Excel evaluates all four limits. The absolute references keep the mean and standard deviation fixed.
TRUE asks for cumulative probabilities. The results are 69.1%, 84.1%, 93.3%, and 97.7% for limits from 38 through 44 minutes.
Pro Tip: The spill range B2:B5 must be empty before you enter the formula. A blocked output cell causes a #SPILL! error.
Example 2: Probability Between Two Limits
A probability between two values needs two cumulative calculations.
Below is a parameter card for call duration. The mean is 5 minutes, the standard deviation is 1.2, and the limits are 3.5 and 6.5.
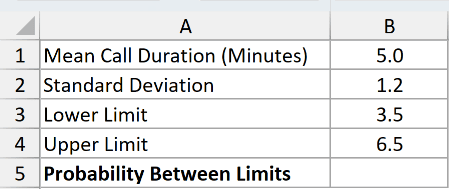
I want the probability that a call lasts between 3.5 and 6.5 minutes.
Enter this formula in cell B5:
=NORM.DIST(B4,B1,B2,TRUE)-NORM.DIST(B3,B1,B2,TRUE)
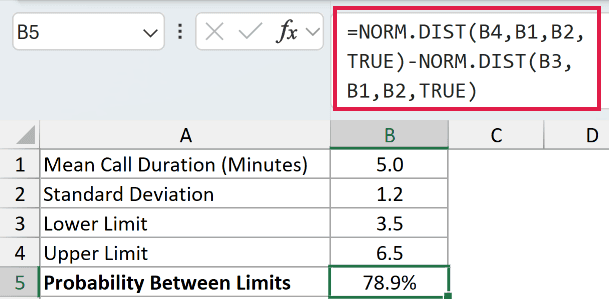
The first NORM.DIST returns the probability at or below 6.5 minutes. The second returns the probability at or below 3.5 minutes.
Subtracting the lower cumulative probability leaves the share between the two limits. The result is 78.9%.
Example 3: Compare Cumulative Probability and Density
The cumulative argument changes what NORM.DIST returns.
Below are call durations from 2 through 8 minutes, with a mean of 5 and a standard deviation of 1.2.
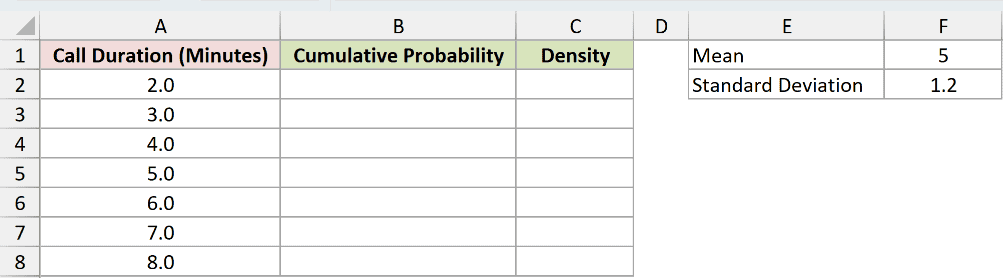
I want both cumulative probability and density for every duration.
Enter this cumulative formula in cell B2:
=NORM.DIST(A2:A8,$F$1,$F$2,TRUE)
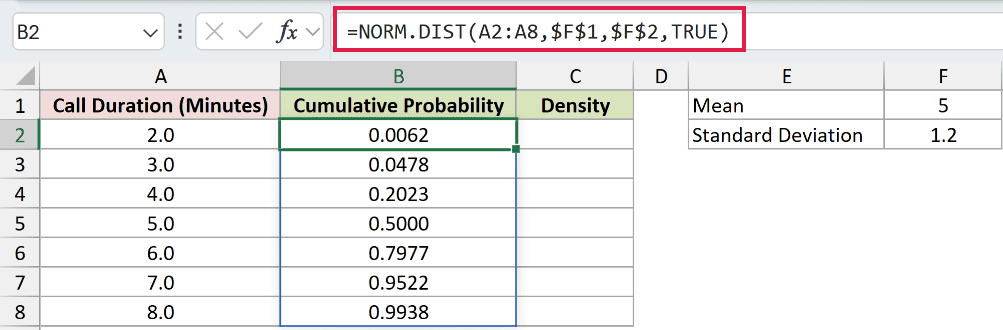
TRUE produces an S-shaped cumulative series. It rises from 0.0062 at 2 minutes to 0.9938 at 8 minutes.
Now enter this density formula in cell C2:
=NORM.DIST(A2:A8,$F$1,$F$2,FALSE)
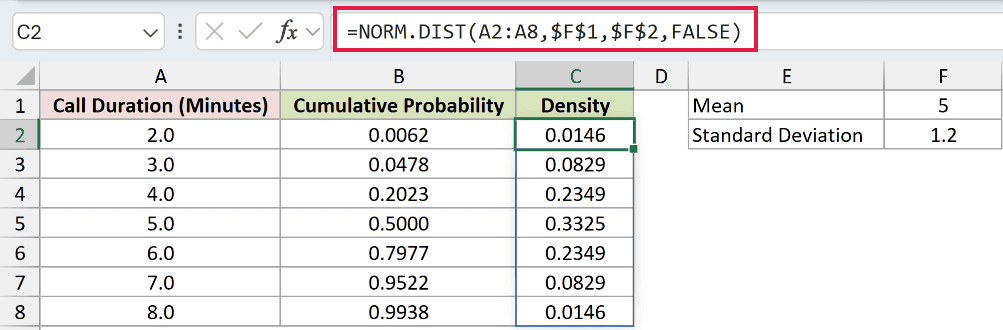
FALSE returns the height of the normal curve at each duration. The density peaks at 0.3325 when x equals the mean of 5.
The density value is not the probability of an exact duration. A continuous variable has zero probability at any single exact point.
Example 4: Match the Standard Normal Distribution
NORM.S.DIST is the direct function when you already have a z score.
Below is a z score of 1.5, along with a normal distribution whose mean is 10 and standard deviation is 2.
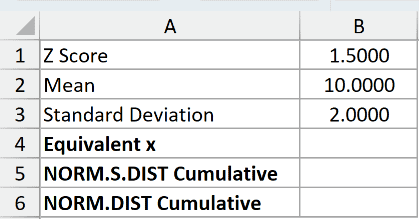
I want to confirm that both functions return the same cumulative probability after converting z to x.
First, enter this conversion formula in cell B4:
=B2+B1*B3
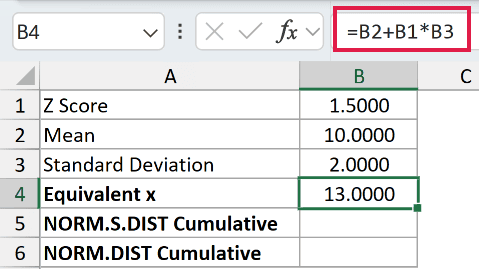
The formula calculates x as mean plus z times standard deviation. The equivalent x value is 13.0000.
Next, enter the standard normal formula in cell B5:
=NORM.S.DIST(B1,TRUE)
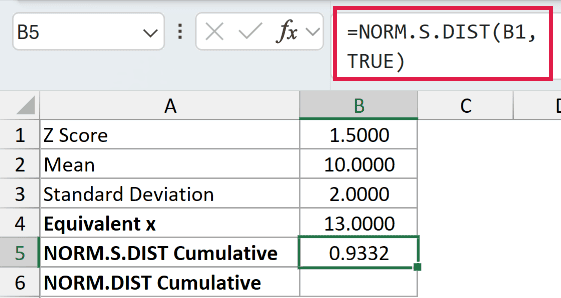
NORM.S.DIST returns 0.9332 for the z score of 1.5.
Finally, enter this NORM.DIST formula in cell B6:
=NORM.DIST(B4,B2,B3,TRUE)
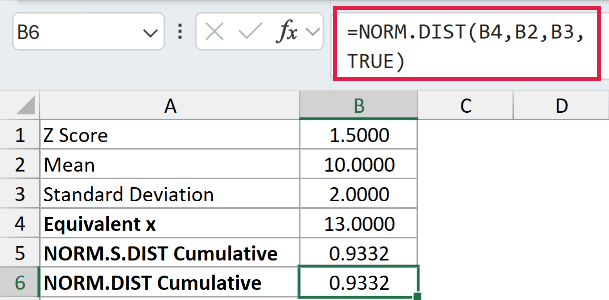
NORM.DIST also returns 0.9332. Standardizing x or converting z back to x gives the same cumulative probability.
Example 5: Estimate Probability From Sample Data
You can calculate the distribution parameters directly from sample data.
Below are fill weights from eight production batches. The target weight in cell B11 is 6 ounces.
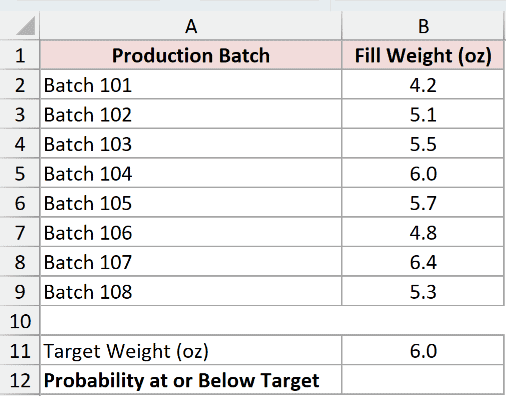
I want to estimate the probability that a fill weight is at or below 6 ounces.
Enter this formula in cell B12:
=NORM.DIST(B11,AVERAGE(B2:B9),STDEV.S(B2:B9),TRUE)
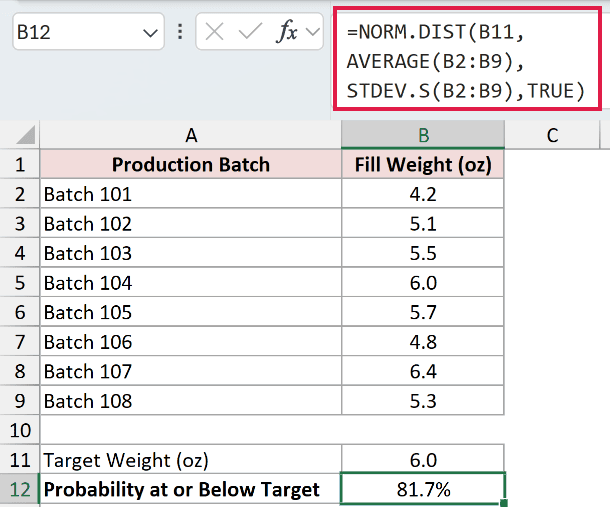
AVERAGE calculates a sample mean of 5.3750 ounces. STDEV.S calculates a sample standard deviation of about 0.6923 ounces.
NORM.DIST uses those estimates and returns 81.7% for a target of 6 ounces.
This percentage relies on the assumption that fill weights follow a normal distribution. It is a model estimate, rather than the measured share in these eight batches.
Pro Tip: Use STDEV.S when the readings are a sample. Use STDEV.P when your range contains the complete population you want to analyze.
Tips & Common Mistakes
- Use TRUE when you need probability at or below x. Use FALSE when you need the curve’s density at x.
- To find a probability between two values, subtract the cumulative probability at the lower limit from the cumulative probability at the upper limit.
- Keep
standard_devgreater than zero. NORM.DIST returns #NUM! when it is zero or negative. - Use NORM.S.DIST when the mean is 0 and the standard deviation is 1.
- In Excel 2019 or earlier, range-based NORM.DIST formulas do not spill. Enter one formula per row or use a legacy array formula.
- Check whether a normal distribution is a reasonable model before treating the result as a probability for your real data.
I covered cumulative probabilities, probabilities between limits, density values, standard normal comparisons, and estimates from sample data.
I hope you found this article helpful.
Other Excel articles you may also like:
