The benefits of the z-score in statistics are manifold.
They help standardize raw scores of a normal distribution, help determine the probability of finding a given score within a standard normal distribution and also help compare two values that are from two different samples (that might have different means and standard deviations.
In this tutorial, we will show you how to compute the z-score in Excel.
What is Z-score and How to Calculate It?
The z-score indicates how many standard deviations a given value is either below or above the mean.
It is also known as a Standard Score. You can find the z-score for any value in a given distribution if you know the overall mean and standard deviation of the distribution.
To calculate the z-score, we use the formula given below:
Z = (x-µ) / σ
Here,
- Z is the z-score value for a given data value
- x is the data value for which the z-score is being calculated
- µ is the mean of the set of data values
- σ is the standard deviation of the set of data values.
Also check: Free Online Z Score Calculator
How to Calculate Z-score in Excel?
There is no direct formula to calculate the z-score in Excel, but it’s fairly easy to get.
As can be seen from the above formula, if you need to find the z-score for a given value in a set of data values, then you will need to first calculate the mean and standard deviation.
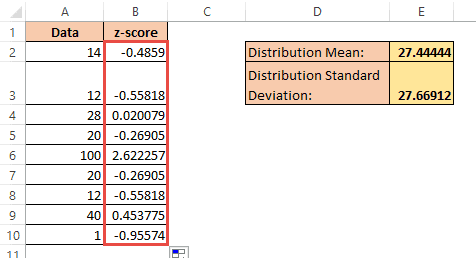
Consider a set of sample data shown below:
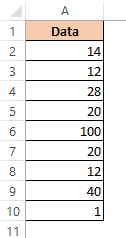
Let us see step-by-step how to compute the z-score for each of the data values in this dataset.
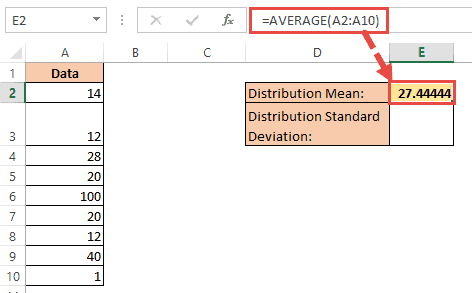
- Compute the mean of the data set. For this, you can use the AVERAGE function. So to find the average of our sample data values, let us use the following formula in (say) cell E2: =AVERAGE(A2:A10).
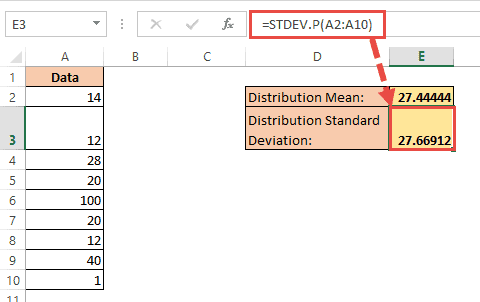
- Next, compute the standard deviation of the data set. There are two functions for this in Excel – STDEV.P and STDEV.S. You can select the function that suits your data set. Usually the results obtained from both functions are more or less similar, so it doesn’t really matter much whether you choose one or the other. To find the standard deviation of our sample data values, let us use the following formula in (say) cell E3 and press the return key: =STDEV.P(A2:A10).
Note: The two functions in Excel that can be used to compute the standard deviation are:
- STDEV.P – This function calculates the standard deviation considering that the data set being worked on comprises the entire population. An example of a population could be scores of all students in a class or sizes of all pencils produced by a factory.
- STDEV.S – This function computes the standard deviation for a sample of the population. An example of a sample of a population could be scores of a few students from a class who have been selected for a research project, or some pencils that were set aside and used for quality testing.
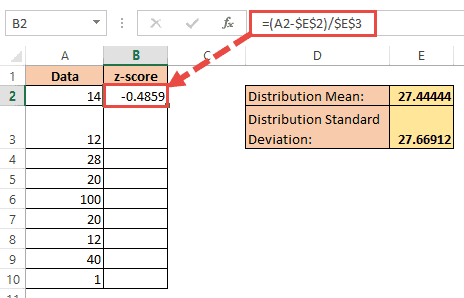
- Once you have the mean and standard deviation for the distribution, you can enter the formula to calculate the z-score in a new column next to the one containing our data values. Type in the formula to calculate the z-score in cell B2. The formula to calculate the z-score is:
=(A2-$E$2)/$E$3
- Copy the formula down to the rest of the cells of column B using the fill handle.
You now have the z-scores corresponding to every value in your dataset!
Also read: How to Calculate Covariance in Excel?
How to Interpret the Z-score value
A z-score of 0 for a particular value indicates that the value in question is equal to the mean.
A positive z-score means that the value in question is more than the mean.
For example, if a value has a z-score of +1, it means the value is 1 standard deviation more than the mean, while a value with a z-score +2 is 2 standard deviations more than the mean.
Similarly, A negative z-score means that the value in question is less than the mean.
For example, if a value has a z-score of -1, it means the value is 1 standard deviation less than the mean, while a value with a z-score of -2 is 2 standard deviations less than the mean.
This also means that the higher the magnitude of the z-score (whether negative or positive), the further the value is from the mean.
So the z-score helps us clearly see how much a given value deviates from the mean.
For example, the 5th value in our dataset (cell A6) is 100, and we got a z-score for it of 2.622. You can thus say that the value 100 is 2.6 standard deviations below the mean, and this value is further away from the mean than the value (say) 28.
The z-score is especially helpful when you’re trying to compare two different distributions that might have different means and variances.
For example, one cricket player might have scored 100 runs in a match, while another player might have scored 150 runs in another match.
Simply looking at the magnitude of the scores makes it easy to assume that player 2 is a better player than player 1.
However, they might have made those scores in different situations.
Maybe the competing team playing against player 2 was weaker, or maybe the weather was unfavorable the day player 1 made that score.
Comparing the z-scores of the two players could reveal that player 1 actually did better than player 2 in comparison to the scores of other players during their individual matches.
In this tutorial, we explained the concept of the z-score in statistics and how it is used and interpreted.
We also showed you how to use the AVERAGE and STDEV.P (or STDEV.S) functions to compute the z-score for a given set of values. We hope you found this helpful and easy to follow.
Other articles you may also like:
- How to Get the p-Value in Excel? 2 Easy Ways!
- How to Calculate Confidence Interval in Excel
- How to Calculate Standard Error in Excel (Step-by-Step)
- How to Find Percentile in Excel (PERCENTILE Function)
- How to Find Slope in Excel (Easy Formula)
- How to Calculate Percentage Difference in Excel
- Calculate the Coefficient of Variation in Excel
- Interquartile Range in Excel
- Calculate Class Width in Excel
- Calculate CHI-SQUARE in Excel