
The FISHERINV function in Excel converts a Fisher z value back to a correlation coefficient, usually written as r.
It’s the last step when you calculate correlation confidence intervals or combine correlations. Do the calculations on the Fisher z scale, then convert back to report the result.
FISHER moves a correlation onto that scale. FISHERINV brings it back, so you can interpret the direction and strength of the relationship.
In this article, I’ll show you how to reverse Fisher transformations, calculate correlation confidence intervals, and combine correlations from equally sized or differently sized samples.
FISHERINV Function Syntax in Excel
FISHERINV takes the value you want to convert back from the Fisher z scale:
=FISHERINV(y)
- y (required): The Fisher z value to convert. You can supply a number, a cell reference, or a range of values.
The input is a transformed value, not the original correlation. FISHERINV doesn’t calculate a correlation directly from paired observations; CORREL handles that step.
When to Use FISHERINV Function
- Convert reported Fisher z values back into correlation coefficients.
- Return confidence-interval endpoints from the z scale to the correlation scale.
- Combine equally sized samples by averaging their Fisher z values before converting back.
- Pool correlations from differently sized studies using weighted Fisher z values.
Example 1: Convert Fisher z Values Back to Correlations
Let’s start with a column of transformed values from a sample health-study report.
Below is the dataset. Column A names each variable pair, column B holds Fisher z values, and column C is the empty Correlation (r) result column.
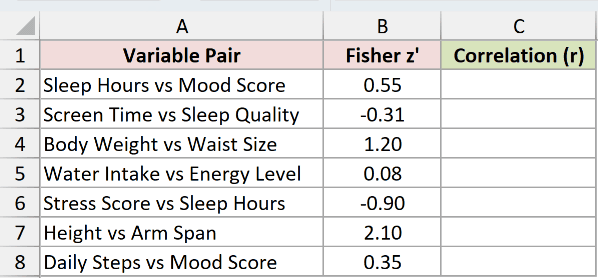
We want to convert each transformed value back to its correlation coefficient.
Enter this formula in C2:
=FISHERINV(B2:B8)
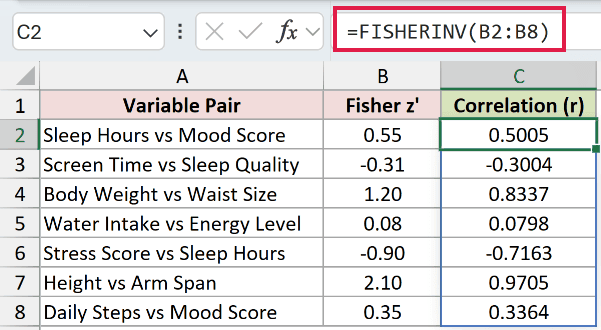
The results spill into C2:C8. Sleep Hours vs Mood Score returns 0.5005, while Screen Time vs Sleep Quality returns -0.3004.
The transformation preserves the sign.
Height vs Arm Span returns 0.9705. Large positive transformed values move the correlation toward its upper limit without pushing it beyond that limit.
FISHERINV itself works in every Excel version. This range formula spills in Excel 2021, Excel 2024, and Microsoft 365.
In Excel 2019 and earlier, reference the individual input cell and fill the per-row version down instead.
Pro Tip: Keep the output cells below C2 empty before entering the formula. A blocked spill range causes #SPILL!.
Example 2: Back-Transform a Correlation Confidence Interval
FISHERINV converts both endpoints of a Fisher z interval back to correlations.
Below is the dataset. Columns A:C contain participants, daily steps in thousands, and resting heart rates. The E:F card labels the calculations and final interval endpoints.
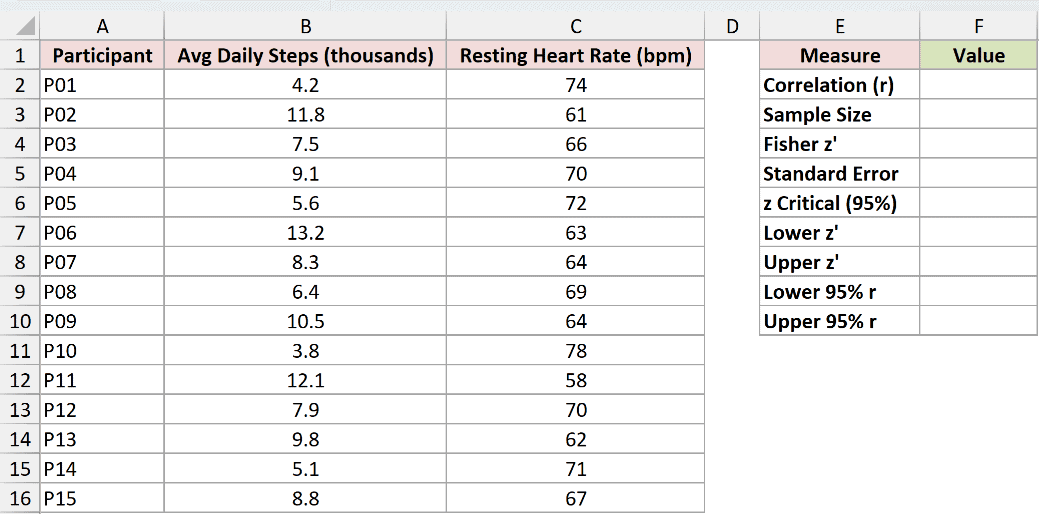
We want an approximate 95% confidence interval for the correlation between daily steps and resting heart rate.
First, calculate the correlation in F2:
=CORREL(B2:B16,C2:C16)
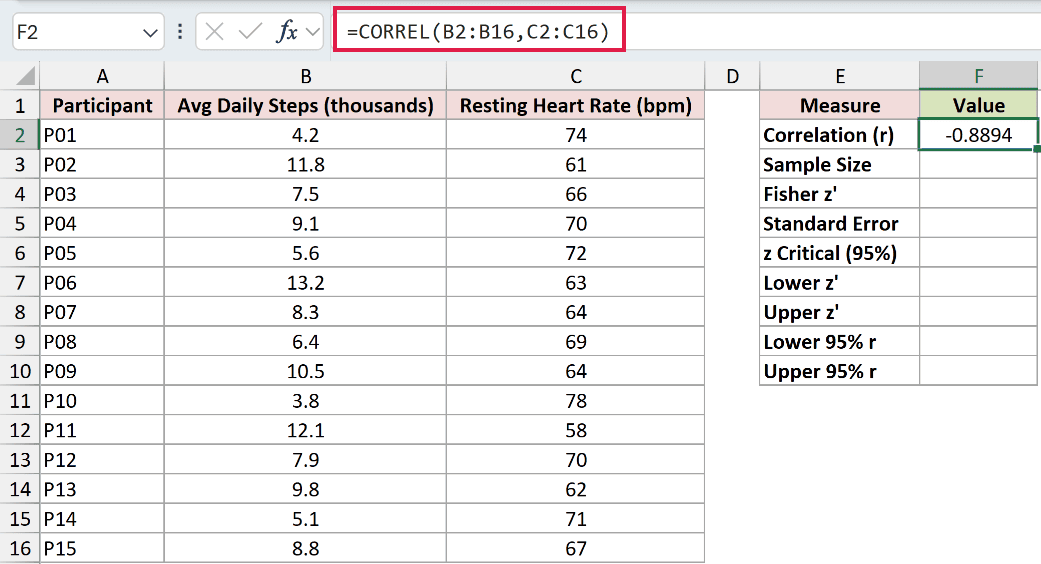
CORREL returns -0.8894, showing a negative relationship in this sample.
Count the observations in F3:
=COUNT(B2:B16)
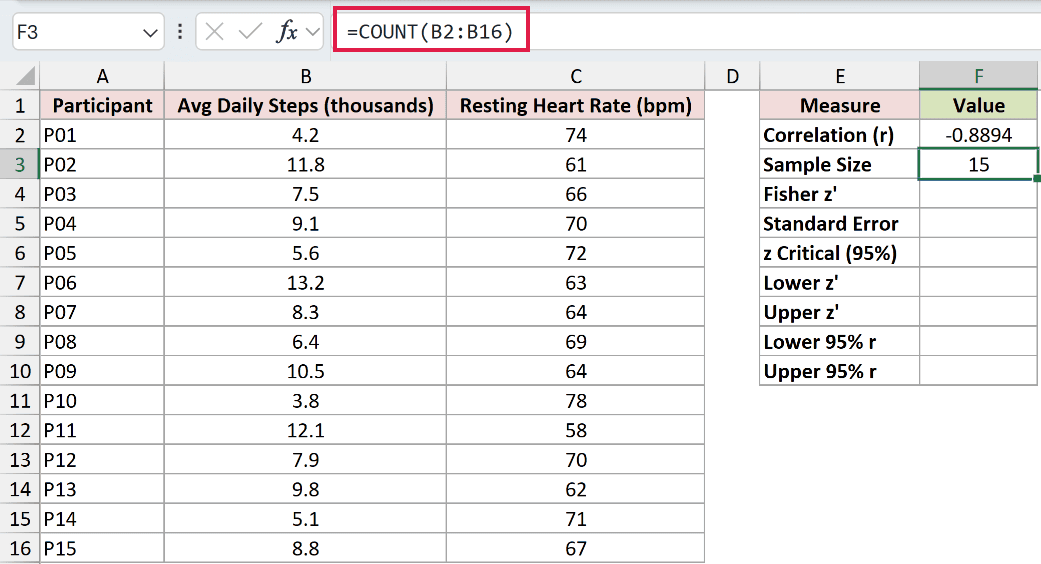
The sample size is 15. Every participant here has both measurements, so counting the steps column counts the complete pairs.
Convert the correlation to Fisher z in F4:
=FISHER(F2)
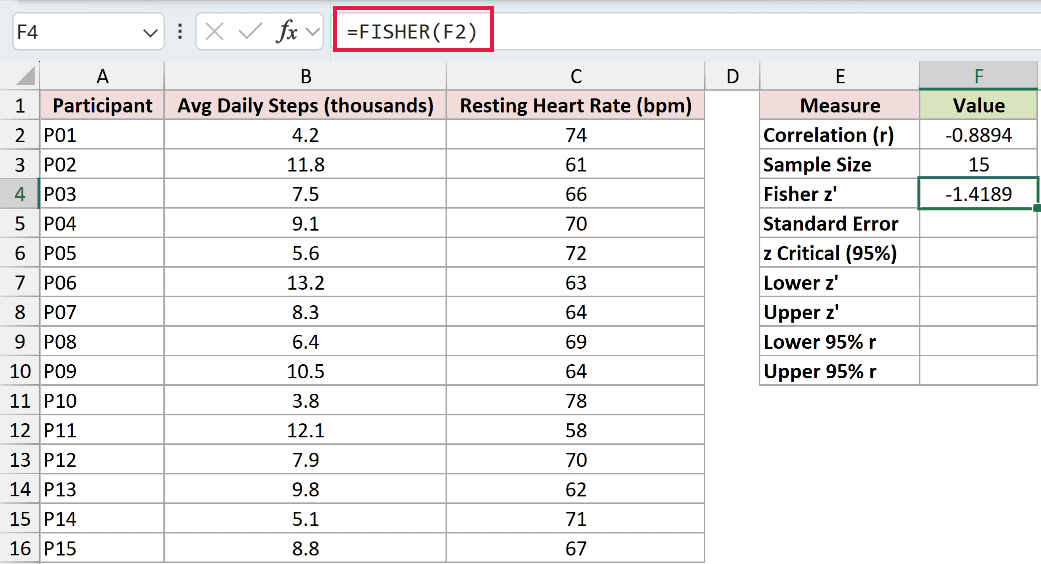
The transformed value is -1.4189.
Calculate the standard error on the z scale in F5:
=1/SQRT(F3-3)
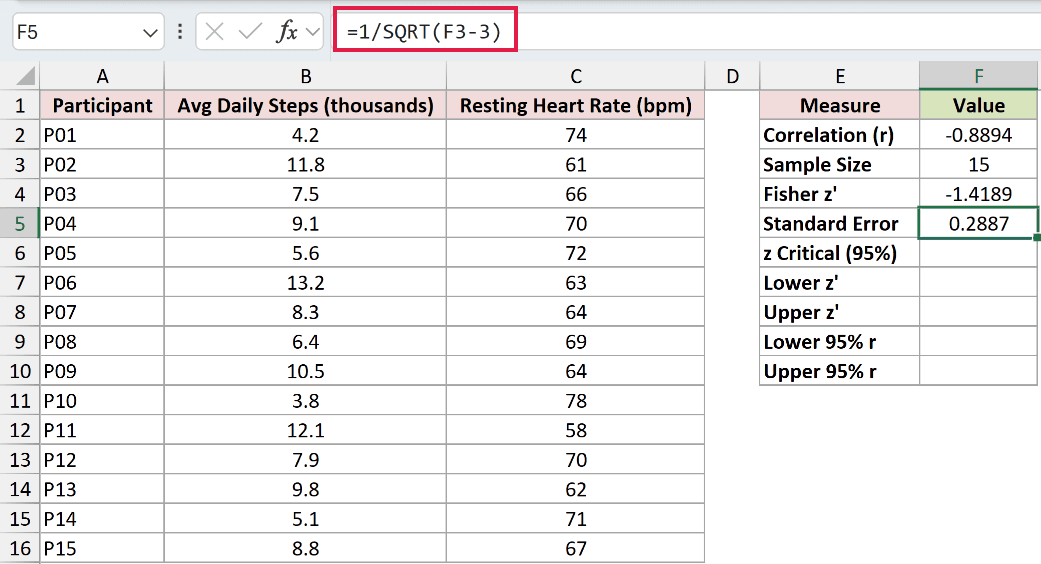
The standard error is 0.2887, calculated from the sample size.
Calculate the critical z value for the 95% interval in F6:
=NORM.S.INV(0.975)
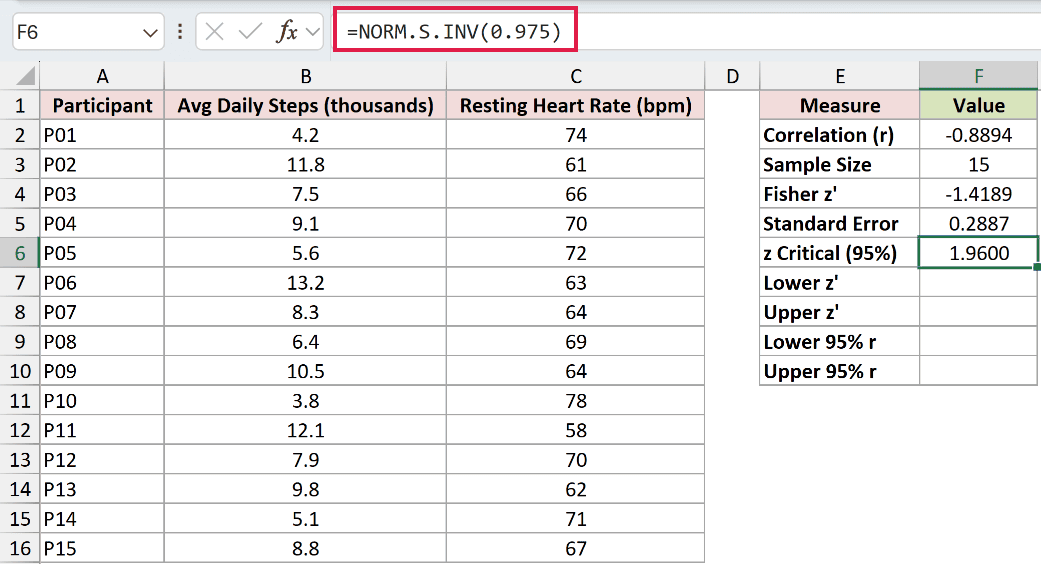
The critical value is 1.9600. The probability argument leaves equal tail areas outside the interval.
Calculate the lower endpoint on the z scale in F7:
=F4-F6*F5
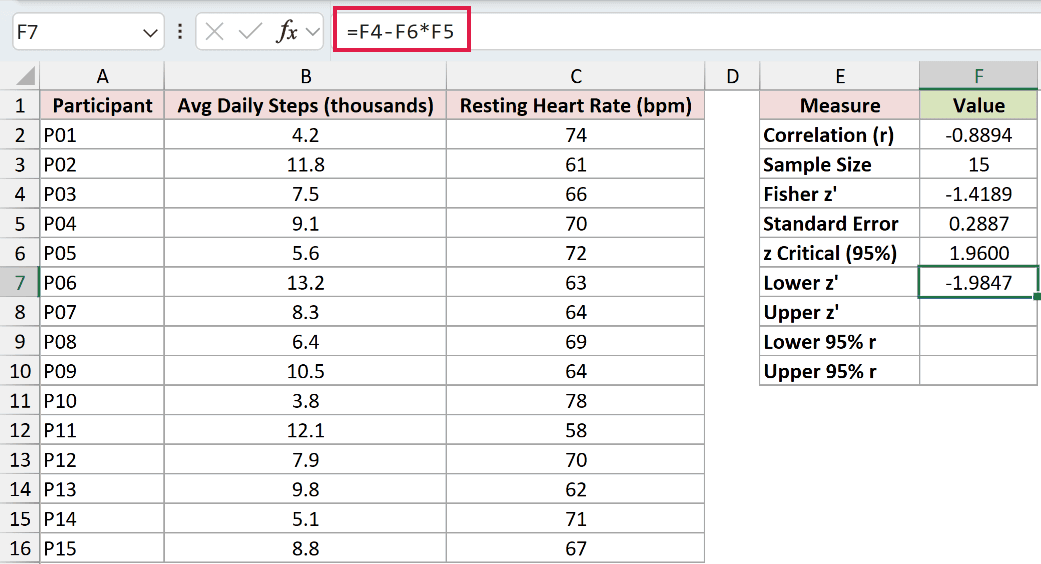
This returns -1.9847 by subtracting the margin from the transformed correlation.
Calculate the upper endpoint on the z scale in F8:
=F4+F6*F5
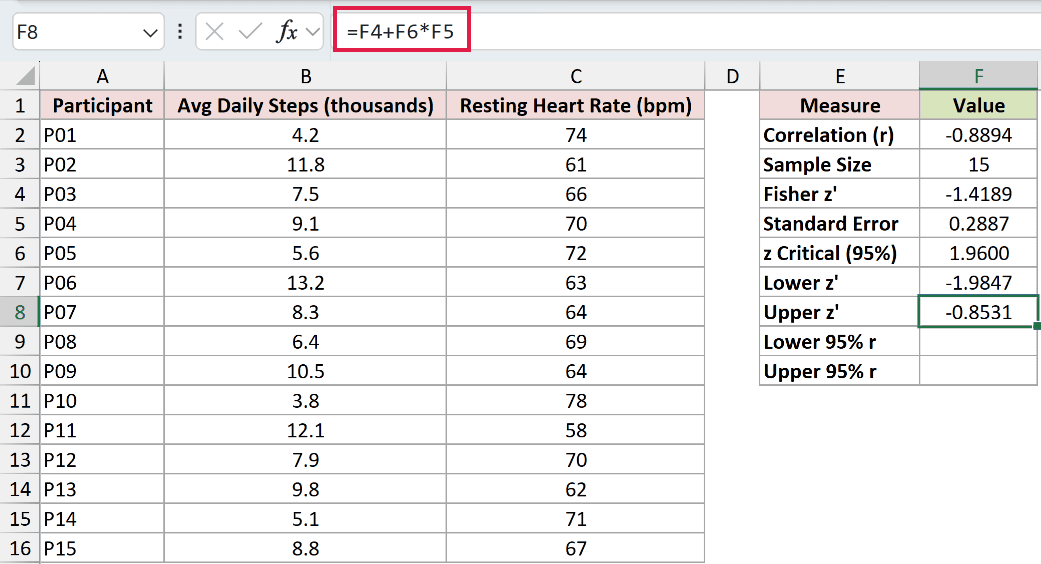
This returns -0.8531. These endpoints are still Fisher z values, so they’re not ready to report as correlation bounds.
Use FISHERINV in F9 to return the lower endpoint to the correlation scale:
=FISHERINV(F7)
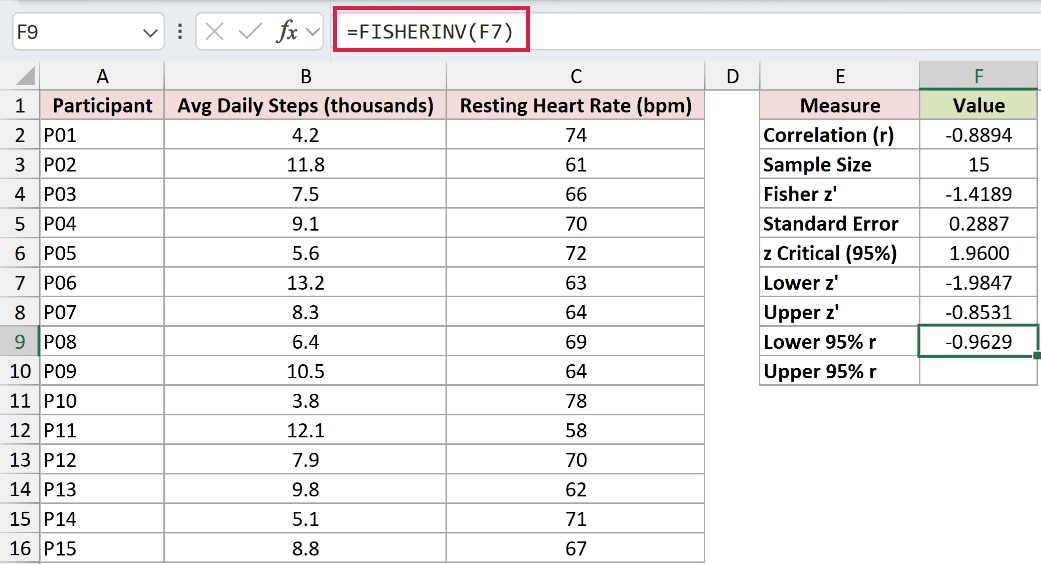
The lower correlation bound is -0.9629.
Convert the upper endpoint in F10:
=FISHERINV(F8)
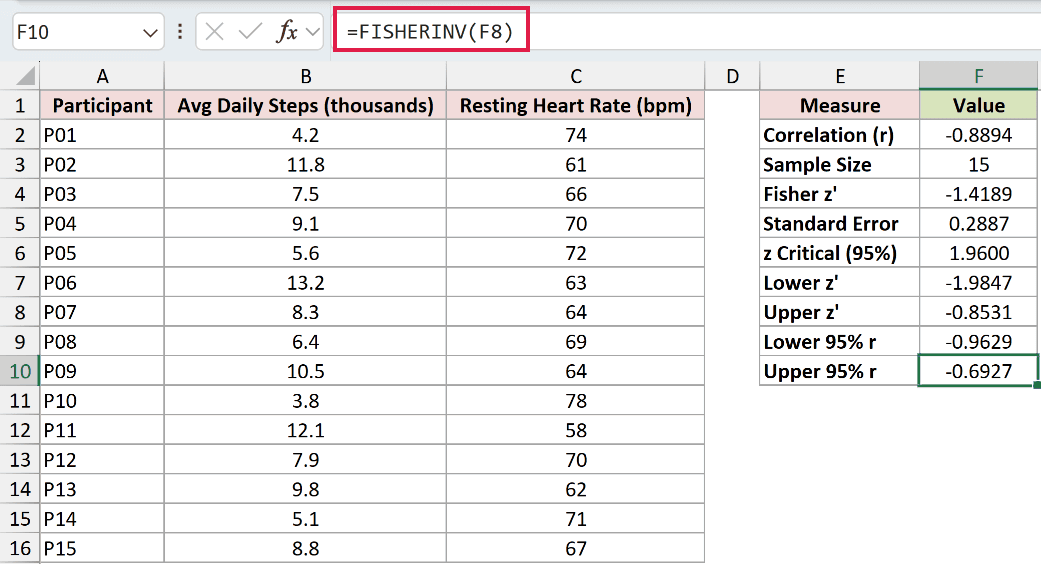
The upper bound is -0.6927, giving a 95% confidence interval from -0.9629 to -0.6927.
Notice that the endpoints aren’t equally distant from the sample correlation of -0.8894. The interval is symmetric on the z scale, but the back-transformation makes it asymmetric.
Pro Tip: Reference the calculated cells throughout the card. Typing the displayed, rounded values into later steps throws away precision before FISHERINV converts the endpoints.
Example 3: Calculate Intervals From Summary Correlations
You can also work from reported correlations and sample sizes without rebuilding the raw-data calculation.
Below is the dataset. Columns A:C list markets, price-versus-days-on-market correlations, and homes sold. Columns D:E have headers and result cells for the interval bounds.
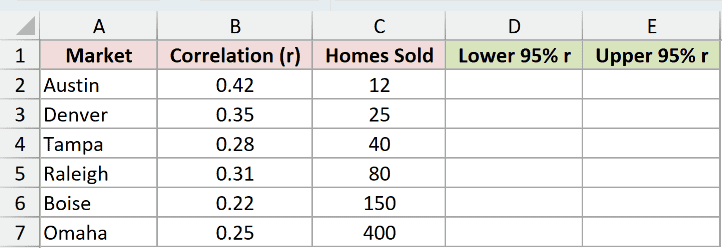
We want a 95% correlation confidence interval for each market using its own sample size.
Enter the lower-bound formula in D2:
=FISHERINV(FISHER(B2:B7)-NORM.S.INV(0.975)/SQRT(C2:C7-3))
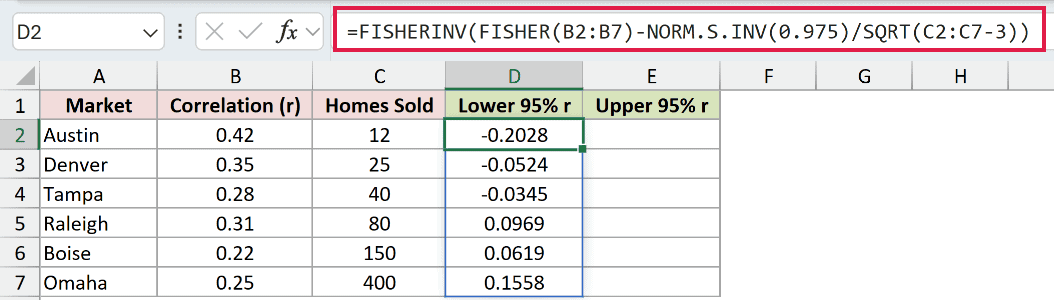
The lower bounds spill into D2:D7. Austin’s lower bound is -0.2028, while Omaha’s is 0.1558.
Enter the upper-bound formula in E2:
=FISHERINV(FISHER(B2:B7)+NORM.S.INV(0.975)/SQRT(C2:C7-3))
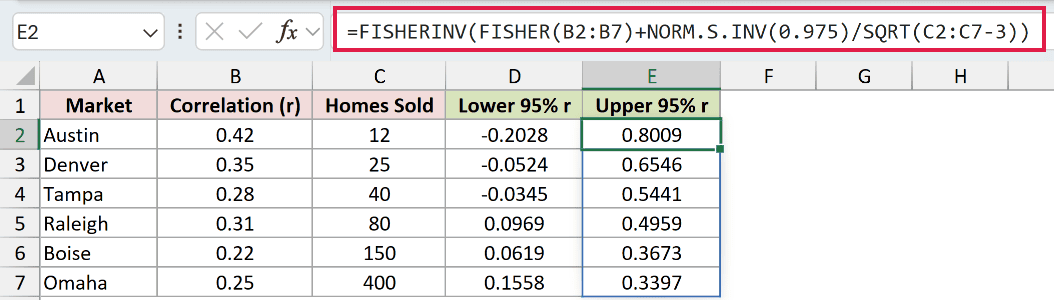
The upper bounds spill into E2:E7. Austin’s upper bound is 0.8009, while Omaha’s is 0.3397.
How these formulas work:
- FISHER converts each correlation in column B to the z scale.
- NORM.S.INV provides the critical value, and SQRT uses each sample size in column C to calculate the standard error.
- Subtraction produces the lower z endpoint; addition produces the upper endpoint.
- FISHERINV converts each endpoint back to the correlation scale.
Austin’s interval runs from -0.2028 to 0.8009. Omaha’s runs from 0.1558 to 0.3397, a much narrower interval.
Larger samples reduce uncertainty on the z scale. The reported correlation also affects the interval’s shape after FISHERINV converts it back.
Austin, Denver, and Tampa have intervals spanning negative and positive correlations. Their intervals don’t establish a direction for the population relationship at this confidence level.
Example 4: Average Correlations on the Fisher z Scale
Use FISHERINV to convert an average Fisher z value back to a correlation.
Below is the dataset. Columns A:C list months, time-on-page versus scroll-depth correlations, and sessions sampled. The E:F card labels the Fisher average and plain-average mistake.
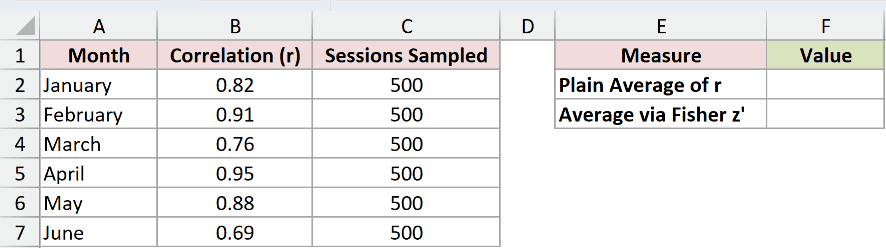
We want to combine the monthly correlations by averaging on the Fisher z scale, then converting back.
Enter the correct formula in F3:
=FISHERINV(AVERAGE(FISHER(B2:B7)))
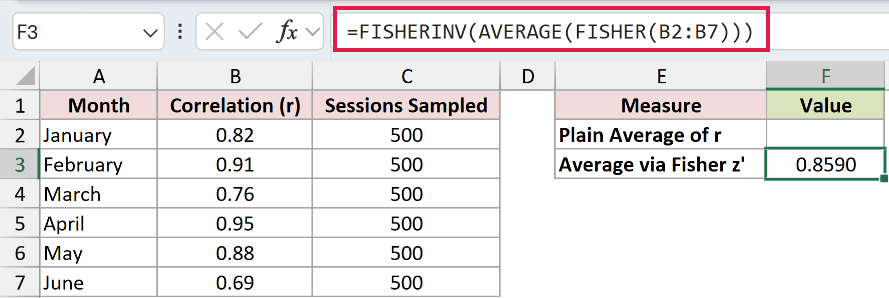
The result is 0.8590. FISHER transforms each monthly correlation, AVERAGE combines the transformed values, and FISHERINV returns the combined correlation.
Each month samples 500 sessions, so the samples receive equal weight here.
For comparison, F2 demonstrates the mistake of averaging the raw correlations directly:
=AVERAGE(B2:B7)
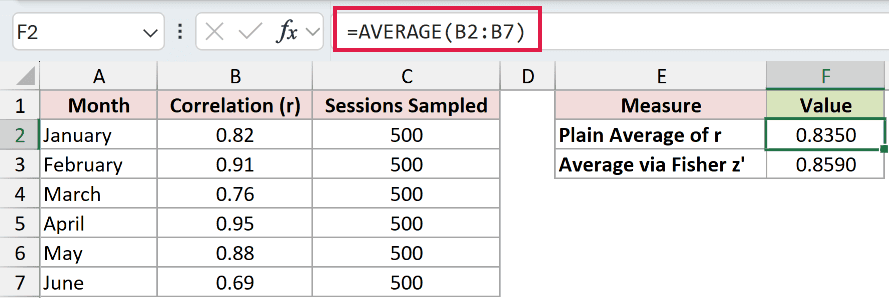
The plain-average mistake returns 0.8350. It understates the Fisher-based result because it averages on the correlation scale instead of the transformed scale.
The white comparison cell F2 shows what to avoid. Use the Fisher-based result in F3 for this calculation.
Pro Tip: In Excel 2019 and earlier, confirm the nested AVERAGE and FISHER formula with Ctrl+Shift+Enter. In newer versions, Enter is enough.
Example 5: Weight Correlations by Study Size
Equal weighting stops being appropriate when the studies have different sample sizes.
Below is the dataset. Columns A:C contain sleep-study labels, reported correlations, and participant counts. The E:F card labels the weighted result and unweighted comparison mistake.
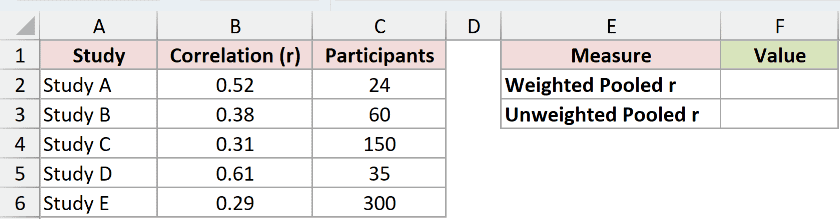
We want to pool the study correlations while giving larger studies more weight on the Fisher z scale.
Enter the weighted formula in F2:
=FISHERINV(SUMPRODUCT(FISHER(B2:B6),C2:C6-3)/SUMPRODUCT(C2:C6-3))
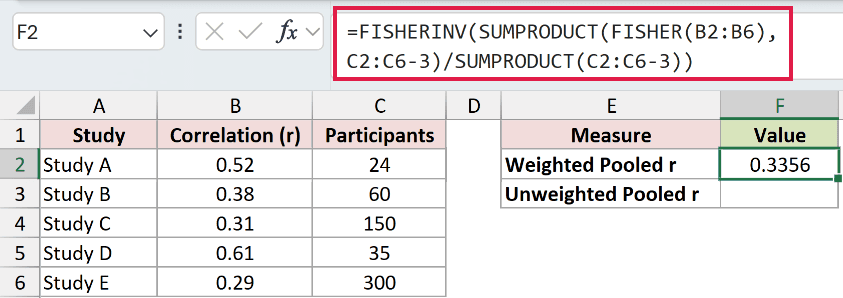
The weighted pooled correlation is 0.3356.
How this formula works:
- FISHER transforms the reported correlations.
- Each participant count minus 3 provides its study’s weight.
- The first SUMPRODUCT multiplies each transformed correlation by its weight and adds the products.
- Dividing by the total weight returns the weighted average on the z scale.
- FISHERINV converts that weighted average back to a correlation.
Study E has 300 participants, while Study A has 24. The larger study therefore has more influence on the pooled result.
The white comparison cell F3 demonstrates the wrong choice here: ignoring the unequal study sizes.
=FISHERINV(AVERAGE(FISHER(B2:B6)))
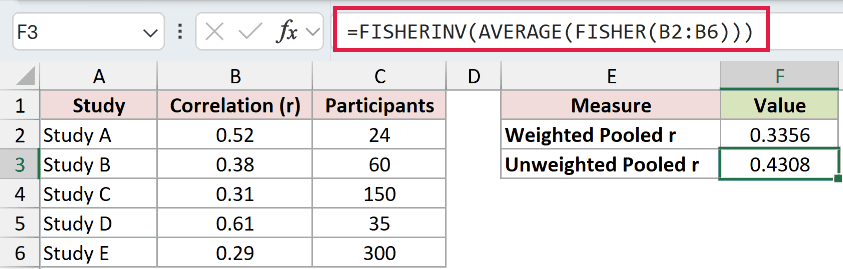
That unweighted mistake returns 0.4308. It transforms the correlations correctly but gives every study equal influence, regardless of the participant count.
Tips & Common Mistakes
- Keep the input scale straight. Supply a Fisher z value to FISHERINV. Use FISHER for the forward transformation and CORREL when starting with paired observations.
- Don’t average raw correlations. Average on the Fisher z scale, using sample-size weights when appropriate, and convert back afterward.
- Don’t use CONFIDENCE.NORM for correlation intervals. It covers means. Correlation intervals need the Fisher transformation and a back-transformation of each endpoint.
- Check blank inputs. A truly empty referenced cell returns 0, which can silently look like a valid converted result.
- Text handling depends on the contents. Numbers stored as text convert, but nonnumeric text returns
#VALUE!. - Large inputs aren’t a documented cutoff error. Testing found no
#NUM!cap for FISHERINV. Extreme inputs approach the correlation limits and can display a limit because of numerical precision. - TANH is mathematically equivalent. FISHERINV makes the statistical purpose clearer when you’re converting Fisher z values back to correlations.
- Watch for implicit intersection. An added
@can reduce a range calculation to an individual result instead of the intended spill.
Related Excel Functions / Articles:
