
The WEIBULL.DIST function in Excel returns a Weibull cumulative probability or probability density for a value, using shape and scale parameters.
For equipment lifetimes, the cumulative probability estimates the share that will have failed by a chosen age. That makes it useful for comparing service intervals and warranty limits.
The density describes the height of the failure curve instead. Choosing the wrong output changes what your result means, even when the inputs are identical.
In this article, I’ll show you how to calculate failure and survival probabilities, compare failure patterns, and find the life associated with a target failure share.
WEIBULL.DIST Function Syntax in Excel
The function takes these required arguments:
=WEIBULL.DIST(x,alpha,beta,cumulative)
- x is the value to evaluate, such as operating hours or mileage. It must be zero or positive.
- alpha is the shape parameter. It controls the failure pattern and must be positive.
- beta is the scale parameter, also called characteristic life. It must be positive and use the same units as
x. - cumulative selects the output.
TRUEreturns the cumulative probability, or share failed byx.FALSEreturns the probability density, or curve height atx.
WEIBULL.DIST is available in Excel 2010 and later.
When to Use WEIBULL.DIST Function
- Estimate the share of components that will fail before a service or warranty limit.
- Calculate the probability that equipment survives a planned operating period.
- Compare early-failure and wear-out patterns using different shape parameters.
- Check the failure probability associated with a proposed lifetime or calculated mean life.
Example 1: Calculate Failure Probability by Mileage
Let’s start with a model of brake-pad wear.
Below is the dataset. Column A lists mileage in thousand miles, D2:E2 holds shape and scale inputs, and column B will show the share worn out.
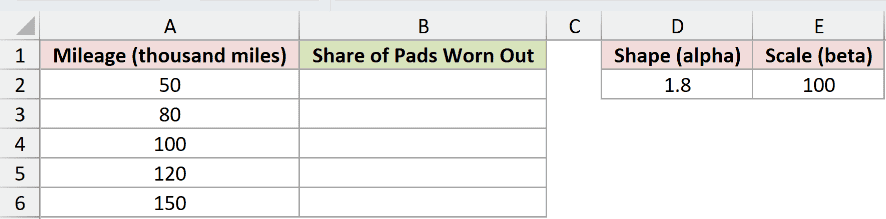
We want the estimated share of pads worn out by each mileage checkpoint.
Enter this formula in B2:
=WEIBULL.DIST(A2:A6,$D$2,$E$2,TRUE)
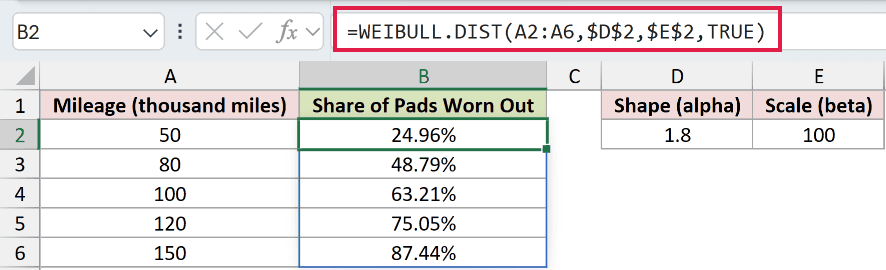
The formula spills into B2:B6. It evaluates each mileage while keeping the shape and scale references fixed.
Range formulas spill in Excel 2021, Excel 2024, and Microsoft 365. In Excel 2019 and earlier, use a single mileage reference and copy the per-row formula down.
At 50 thousand miles, the model returns 24.96% worn out. At 150 thousand miles, it returns 87.44%.
At 100 thousand miles, mileage equals the scale parameter, and the result is 63.21%. This cumulative percentage holds at the scale value for any positive shape.
Pro Tip: Keep mileage and scale in the same units. Here, both use thousand miles. The scale is characteristic life, not the average life or a guaranteed replacement age.
Example 2: Compare Density and Cumulative Probability
Now let’s see why the final argument matters for carbide drill-bit lifetimes.
Below is the dataset. Column A holds cutting hours, E2:F2 holds model inputs, and columns B and C are set up to compare density with cumulative failure.
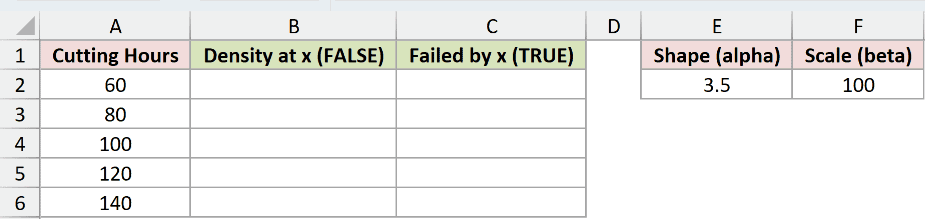
We want to compare the curve height at each age with the share that has failed by that age.
Enter the density formula in B2:
=WEIBULL.DIST(A2:A6,$E$2,$F$2,FALSE)
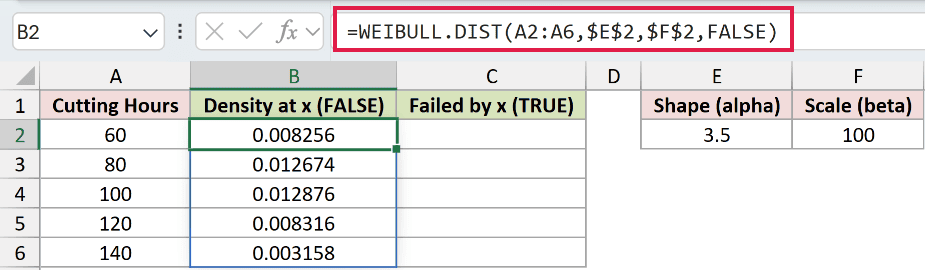
The density side of the comparison spills into B2:B6. At 100 cutting hours, the curve height is 0.012876.
That number is not the probability of failing at exactly that hour. Density describes the curve; probability over an interval comes from the area beneath it.
For the cumulative side of the comparison, enter this formula in C2:
=WEIBULL.DIST(A2:A6,$E$2,$F$2,TRUE)
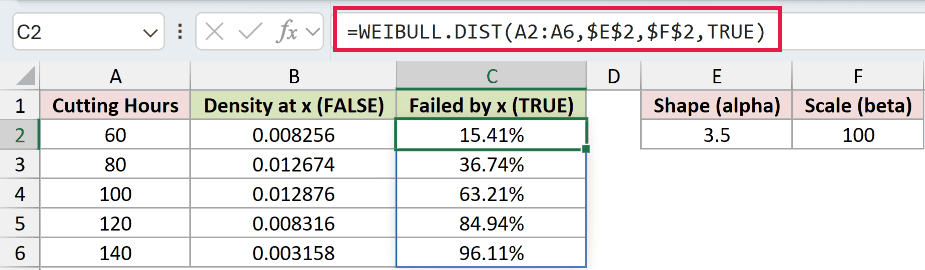
This spills into C2:C6. At the same 100 cutting hours, 63.21% of bits are expected to have failed.
The comparison also shows different movement. Between 100 and 140 hours, density falls from 0.012876 to 0.003158, while cumulative failure rises from 63.21% to 96.11%.
Use the cumulative result for a question about how many have failed by an age. Use density when you need the failure curve’s shape.
Example 3: Calculate Component Reliability
For a planned mission, you’re usually interested in the components that keep working.
Below is the dataset. Columns A:D list components and model inputs; column E will hold reliability, with separate labels for a manual comparison and a deliberate parentheses mistake.
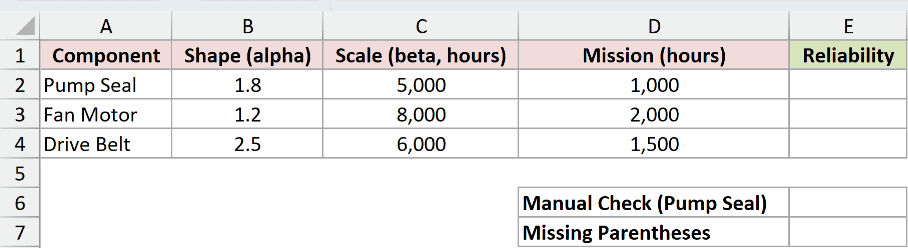
We want each component’s probability of surviving its mission from new.
Enter this formula in E2:
=1-WEIBULL.DIST(D2:D4,B2:B4,C2:C4,TRUE)
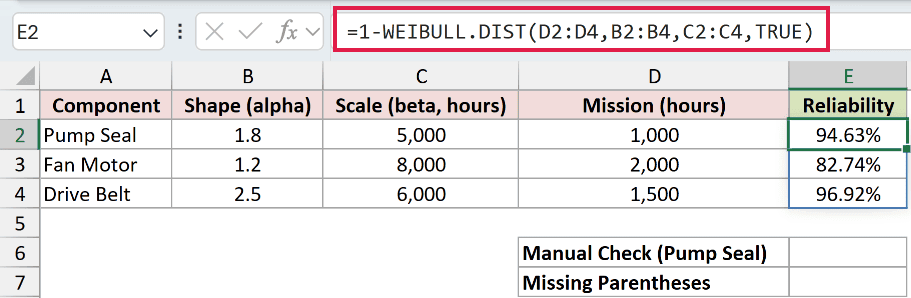
Subtracting cumulative failure from one returns survival probability, also called reliability. The formula pairs each mission duration with its own shape and scale, spilling into E2:E4.
The Pump Seal returns 94.63%, the Fan Motor 82.74%, and the Drive Belt 96.92%, each for its listed mission duration.
For a manual comparison, EXP raises the mathematical constant e to a power. Here, it calculates the same Weibull survival probability directly.
Enter the manual check in E6:
=EXP(-((D2/C2)^B2))
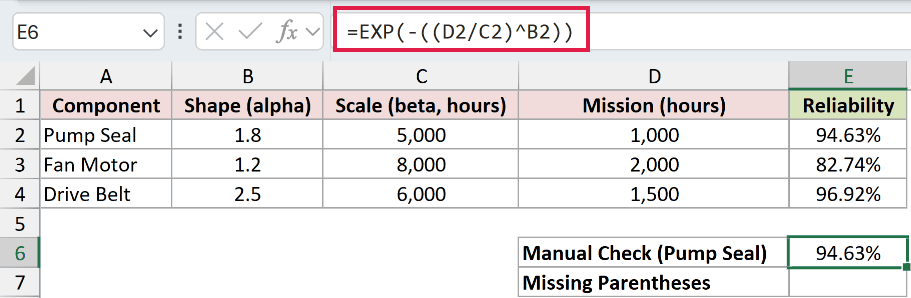
This comparison returns 94.63%, matching the Pump Seal reliability. The inner parentheses ensure Excel calculates the power before applying the minus sign.
The following formula in E7 deliberately demonstrates the missing-parentheses mistake. Don’t use it as the survival calculation:
=EXP(-(D2/C2)^B2)
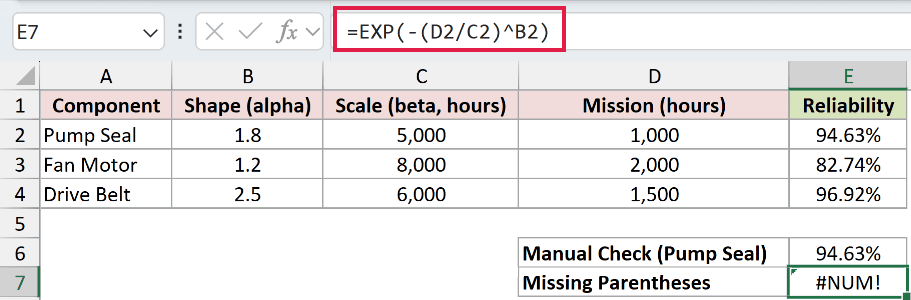
The deliberate mistake returns #NUM!. Excel applies unary minus before exponentiation, so it tries to raise a negative base to the fractional shape power.
Example 4: Compare Weibull Shape Parameters
The same scale can describe very different failure patterns.
Below is the dataset. Columns A:B list shapes and failure patterns, F2:H2 holds scale and checkpoint inputs, and columns C:D will compare cumulative failure at those checkpoints.

We want to compare early and late failure shares while changing only the shape parameter.
For the early-check comparison, enter this formula in C2:
=WEIBULL.DIST($G$2,A2:A5,$F$2,TRUE)

The day-50 comparison spills into C2:C5. Shape 0.7 returns 45.97% failed, while shape 3.5 returns 8.46%.
For the late-check comparison, enter this formula in D2:
=WEIBULL.DIST($H$2,A2:A5,$F$2,TRUE)

The day-150 comparison spills into D2:D5. Shape 3.5 now has the higher failure share at 98.40%, compared with 73.50% for shape 0.7.
The row labels describe how failure risk changes among units still working:
- Early failures: risk decreases with age.
- Random (constant rate): risk stays constant with age.
- Gradual wear-out and rapid wear-out: risk increases with age.
A higher shape doesn’t mean fewer failures at every age. Read both checkpoint comparisons before drawing a conclusion about the model.
Example 5: Estimate Survival for a Used Component
A seal that has already survived part of its life needs a conditional calculation.
Below is the dataset. B1:B4 contains shape, scale, elapsed hours, and target hours. The labeled cells B5:B6 will compare new-seal window failure with used-seal survival.
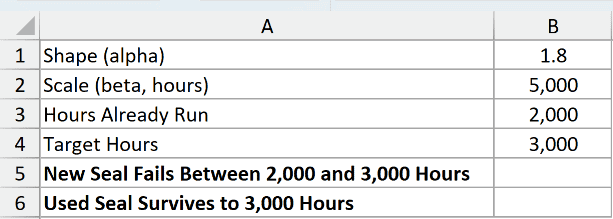
We want to distinguish failure during an age window from survival through that window, given the seal is still working.
First, enter the new-seal window comparison in B5:
=WEIBULL.DIST(B4,B1,B2,TRUE)-WEIBULL.DIST(B3,B1,B2,TRUE)
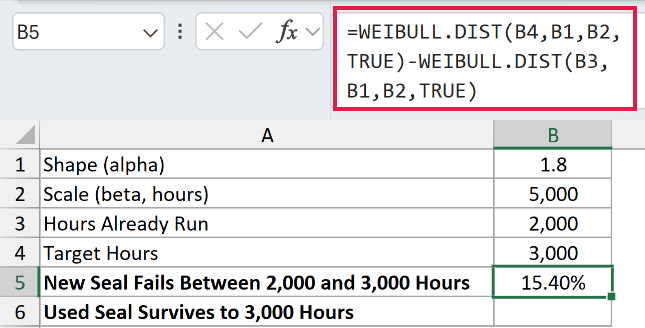
This comparison returns 15.40%. It is the probability, measured from new, that a seal fails between 2,000 and 3,000 hours.
Subtracting the earlier cumulative probability from the later one isolates failures within the window. It doesn’t account for knowing that this particular seal survived to the starting age.
For the used seal’s conditional survival, enter this formula in B6:
=(1-WEIBULL.DIST(B4,B1,B2,TRUE))/(1-WEIBULL.DIST(B3,B1,B2,TRUE))
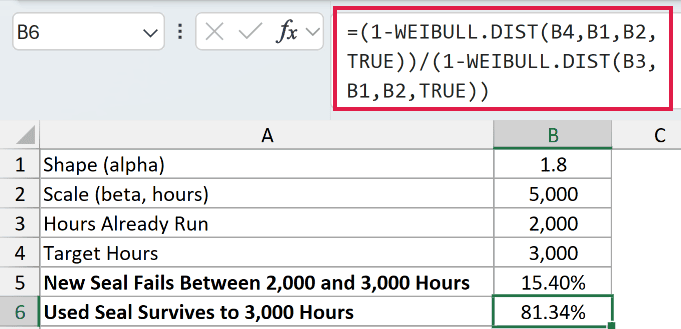
The result is 81.34%. Among seals still working at 2,000 hours, that is the estimated share that will reach 3,000 hours.
The numerator is survival from new to the target. The denominator is survival from new to the age already reached, restricting the calculation to those survivors.
These comparison cells answer different questions. The window failure percentage and conditional survival percentage are not complements of each other.
Example 6: Find Life for a Failure Share
You can also start with a target failure share and work backward to mileage.
Below is the dataset. Column A holds target failure shares, E2:F2 holds model inputs, and columns B:C will show estimated life and a cumulative-probability check.

We want the mileage associated with each target share, then a check that WEIBULL.DIST returns the original target.
LN returns the natural logarithm. It helps reverse the Weibull cumulative calculation so we can solve for life instead of probability.
Enter this inverse calculation in B2:
=$F$2*(-LN(1-A2:A5))^(1/$E$2)
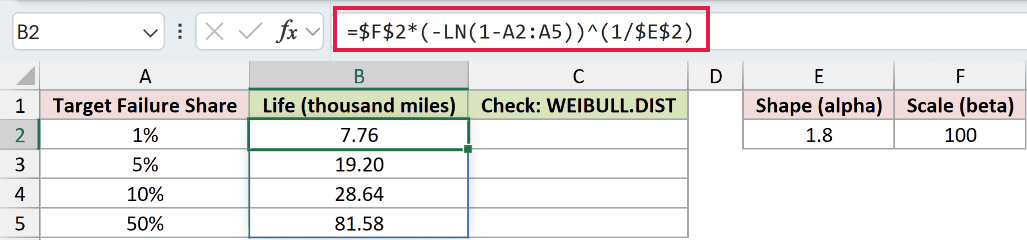
The formula spills into B2:B5, returning 7.76, 19.20, 28.64, and 81.58 thousand miles for the listed targets.
The 10% target gives 28.64 thousand miles, often called B10 life. The 50% target gives 81.58 thousand miles, the median life.
To check those calculated lifetimes, enter this formula in C2:
=WEIBULL.DIST(B2:B5,$E$2,$F$2,TRUE)
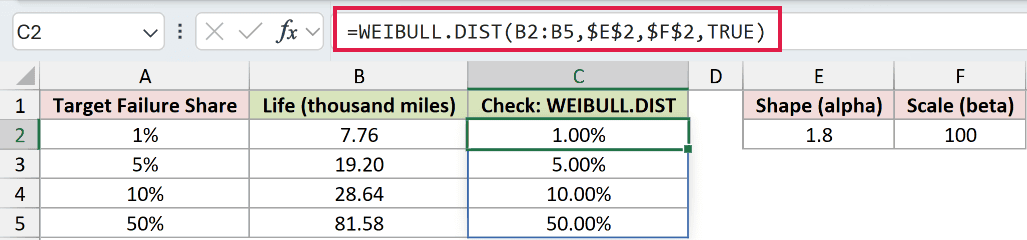
The check column returns 1.00%, 5.00%, 10.00%, and 50.00%, matching the target shares.
It references the calculated cells, so the check uses their stored precision rather than the rounded mileage displayed on screen.
Example 7: Check Failure Before Mean Life
Average life isn’t the point where half the components have failed.
Below is the dataset. B1:B2 holds the brake-pad shape and scale inputs, with labeled cells B3:B4 for mean life and the cumulative failure share at that life.
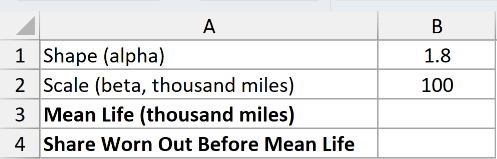
We want the model’s mean life and the share of pads expected to wear out before it.
GAMMA evaluates the mathematical gamma function, which supplies the shape adjustment needed to calculate a Weibull model’s mean life from its scale.
Enter the mean-life calculation in B3:
=B2*GAMMA(1+1/B1)
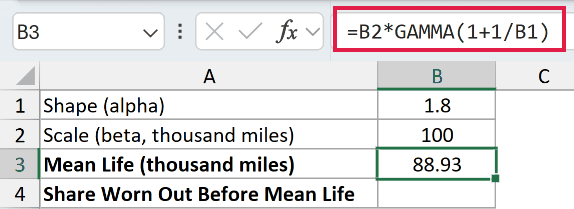
The mean life is 88.93 thousand miles. This average differs from both the scale value and the median life.
Now enter this formula in B4 to evaluate cumulative failure at the calculated mean:
=WEIBULL.DIST(B3,B1,B2,TRUE)
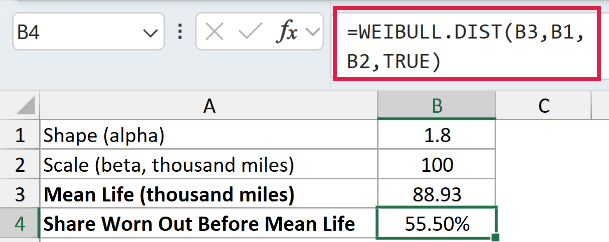
The result is 55.50%. More than half the pads are expected to wear out before the mean life in this model.
Longer-lived pads pull the average upward. For a replacement threshold tied to an acceptable failure share, use the target-share approach rather than treating the mean as that threshold.
Tips & Common Mistakes
- Check parameter labels. Excel uses
alphafor shape andbetafor scale. Some reliability references use beta for shape, so map the meanings before copying values. - Supply the model parameters. WEIBULL.DIST evaluates the shape and scale you provide. It doesn’t estimate them from raw failure records; use parameters supported by your data or supplier’s model.
- Keep inputs valid. Negative
x, or a shape or scale at or below zero, returns#NUM!. Thecumulativeargument is required. - Don’t confuse density with a failure percentage.
FALSEreturns curve height. ChooseTRUEwhen your question is about failure by a specified age. - Leave spill destinations empty. Occupied output cells can cause
#SPILL!. An inserted@can reduce a range calculation to a single result. - Keep the units consistent. If
xis in hours, scale must also be in hours. Changing the label without converting the input changes the model you’re evaluating.
I covered failure and survival probabilities with WEIBULL.DIST, including how shape and scale affect the results.
I also worked backward from target failure shares and checked how mean life relates to cumulative failure.
Related Excel Functions / Articles:
