
The GAMMA.DIST function in Excel returns a cumulative probability or a probability density for a gamma distribution, using a value, shape, and scale.
You can use it to estimate whether a repair will finish before a deadline or how likely a claim is to exceed a threshold.
The final argument changes what the answer means. Cumulative probability measures the chance at or below a limit; density describes the height of the distribution’s curve.
I’ll show you how to compare deadlines, calculate probabilities between limits, and estimate the shape and scale from a column of claim amounts.
GAMMA.DIST Function Syntax in Excel
GAMMA.DIST takes these required arguments:
=GAMMA.DIST(x,alpha,beta,cumulative)
- x: The value to evaluate, such as a repair-time limit or claim amount. It cannot be negative.
- alpha: The positive shape parameter, which controls the distribution’s shape.
- beta: The positive scale parameter, in the same units as
x. It is not a rate. The distribution’s mean is alpha multiplied by beta. - cumulative: Use
TRUEfor the probability at or belowx, orFALSEfor the density atx.
When to Use GAMMA.DIST Function
- Estimate the chance that a repair finishes within a chosen time limit.
- Prepare density and cumulative-probability columns for a distribution curve.
- Model the time needed to complete a sequence of jobs.
- Calculate the share of claim amounts within a band or above a threshold.
- Compare probabilities from a fitted gamma model with the share observed in your data.
Example 1: Check Repair Completion Within a Limit
Let’s start with repair deadlines and a shared model for repair times.
Below is the dataset. Column A lists repair-time limits, D2:E2 holds shape and scale, and column B is reserved for completion probabilities.
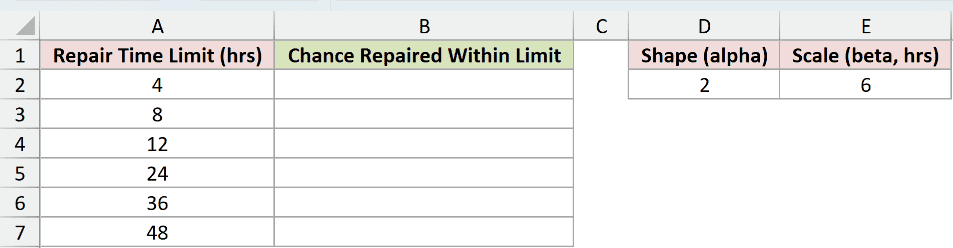
We want the probability that a repair finishes at or before each time limit.
Enter this formula in B2:
=GAMMA.DIST(A2:A7,D2,E2,TRUE)
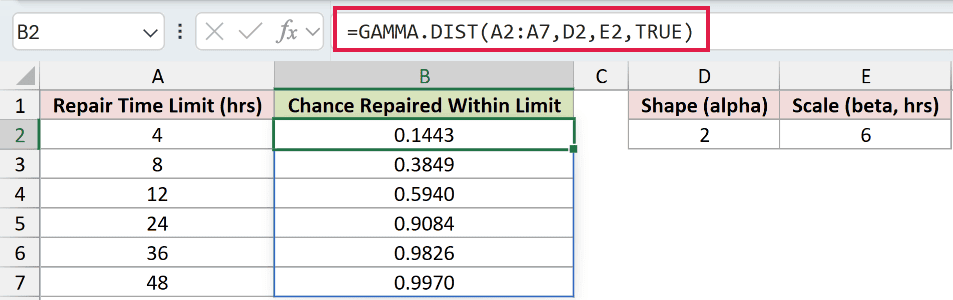
The formula spills into B2:B7. Each limit in A2:A7 uses the shape in D2 and the scale in E2, with TRUE requesting cumulative probability.
For a 4-hour limit, the probability is 0.1443. At 24 hours, it rises to 0.9084, and at 48 hours it reaches 0.9970.
The cumulative result increases as you allow more time for the repair.
Range formulas spill in Excel 2021, Excel 2024, and Microsoft 365. In Excel 2019 and earlier, use a per-row version and fill it down.
Pro Tip: Keep the units consistent. Here, both the repair-time limits and beta are in hours. Beta is the scale, so don’t replace it with a jobs-per-hour rate.
Example 2: Compare Density and Cumulative Probability
The same time limit gives you a curve height with FALSE and a cumulative probability with TRUE.
Below is the dataset. Column A lists ticket resolution times, E2:F2 holds the parameters, and columns B and C will hold density and cumulative probability.
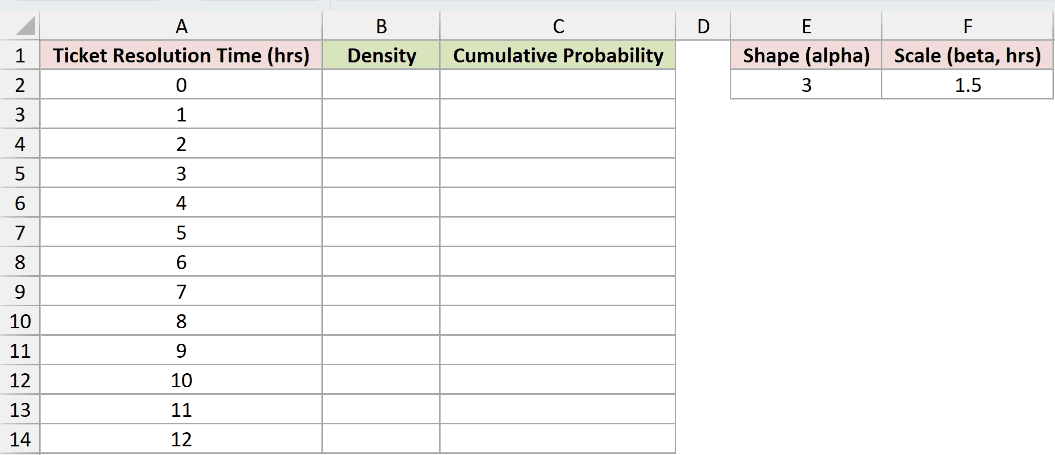
We want to compare the curve height with the chance of resolving a ticket by each listed time.
Enter the density formula in B2:
=GAMMA.DIST(A2:A14,E2,F2,FALSE)
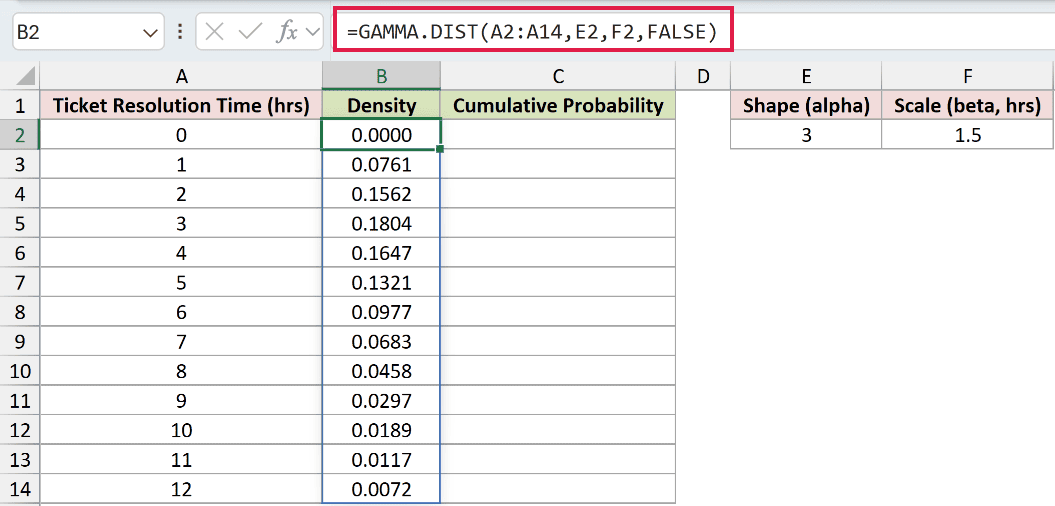
The results spill into B2:B14. At 3 hours, the density is 0.1804, the highest density in this table.
That value is a curve height. It isn’t the probability of a ticket taking exactly 3 hours, and you shouldn’t read it as a percentage.
Enter the cumulative formula in C2:
=GAMMA.DIST(A2:A14,E2,F2,TRUE)
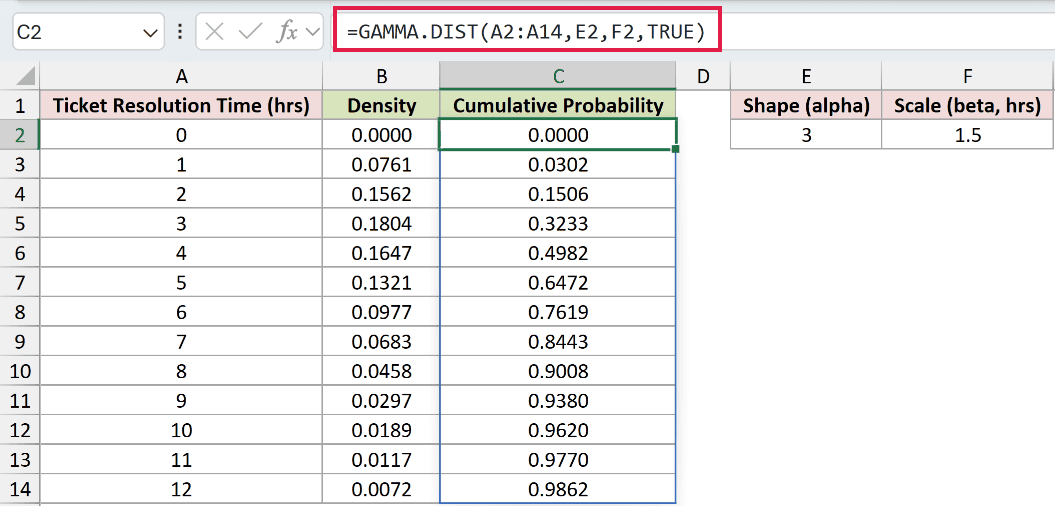
This formula spills into C2:C14. The chance of resolving a ticket within 3 hours is 0.3233. The density beside it measures curve height instead.
At 4 hours, cumulative probability is 0.4982; at 5 hours, it’s 0.6472. Unlike density, the cumulative column keeps increasing across the table.
Changing E2 or F2 recalculates both columns, so you can see how the parameters change the curve and the cumulative probability together.
NORM.DIST and T.DIST use the same switch: TRUE for cumulative probability and FALSE for density.
Example 3: Finish Several Jobs Within a Shift
A gamma model can also describe the total time needed for a sequence of jobs.
Below is the dataset. Column A lists job counts, B will hold completion probabilities, and D:E contains shift inputs and labeled equivalence-check cells.
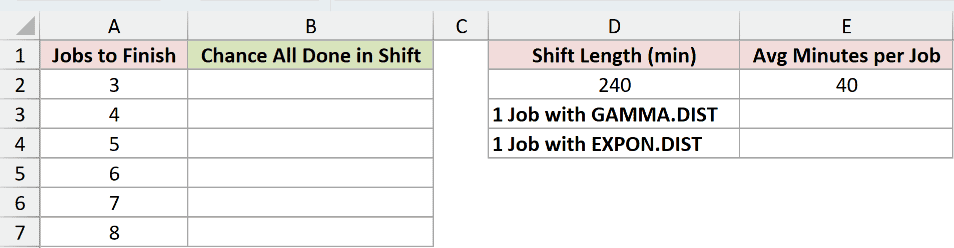
We want the chance of completing each job count within the shift.
Enter this formula in B2:
=GAMMA.DIST(D2,A2:A7,E2,TRUE)
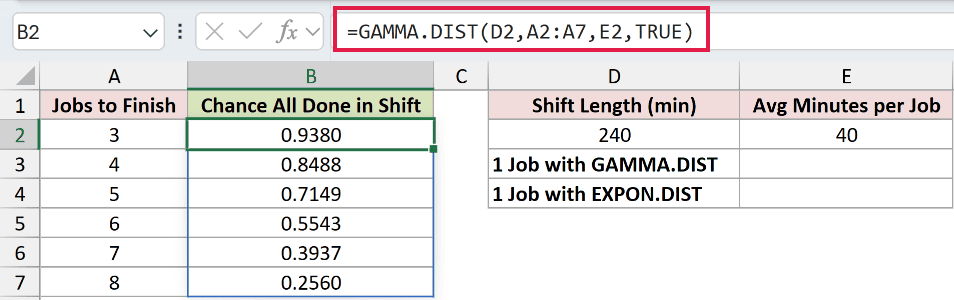
Here, alpha is the number of jobs. Beta is the average time per job, 40 minutes, and D2 supplies the 240-minute shift length.
This model assumes independent, exponentially distributed job times with the same average.
The formula spills down B2:B7 as alpha changes. The chance is 0.9380 for 3 jobs, 0.5543 for 6 jobs, and 0.2560 for 8 jobs.
For the one-job equivalence check, enter this in E3:
=GAMMA.DIST(D2,1,E2,TRUE)
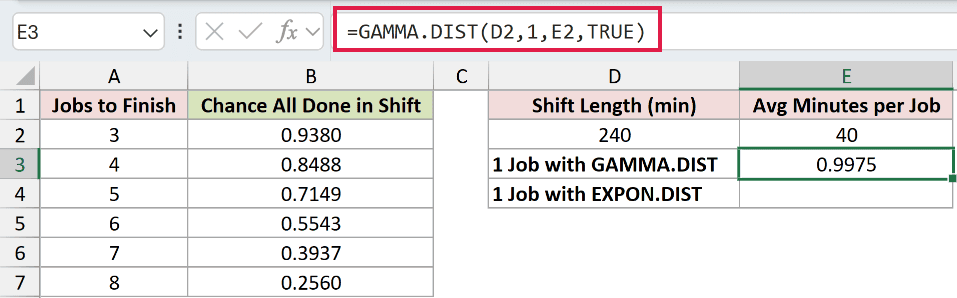
The GAMMA.DIST check returns 0.9975. With alpha set to 1, the gamma distribution matches the exponential distribution.
Enter the EXPON.DIST equivalence check in E4:
=EXPON.DIST(D2,1/E2,TRUE)
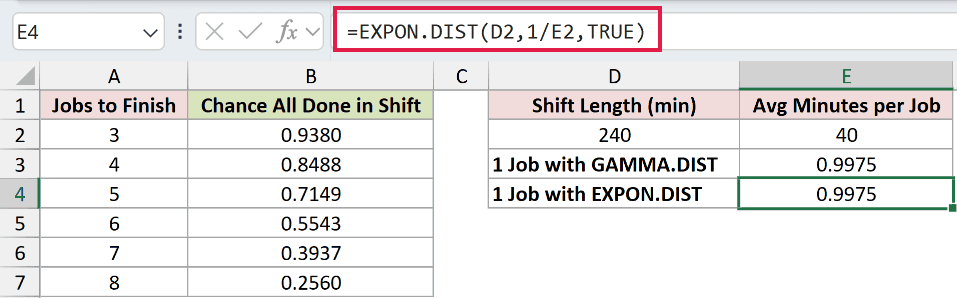
This check also returns 0.9975. EXPON.DIST takes a rate, so 1/E2 converts average minutes per job into jobs per minute.
The E3:E4 checks confirm equivalence for a single job. They aren’t additional answers for the job counts listed in column A.
Example 4: Find Probability Between Claim Limits
For a claim-size band, we need the probability between its lower and upper limits.
Below is the dataset. Columns A:C define claim bands and their limits, F2:G2 holds the model parameters, and D will hold each band’s probability.

We want to estimate the share of claims falling inside each band.
Enter this formula in D2:
=GAMMA.DIST(C2:C5,F2,G2,TRUE)-GAMMA.DIST(B2:B5,F2,G2,TRUE)
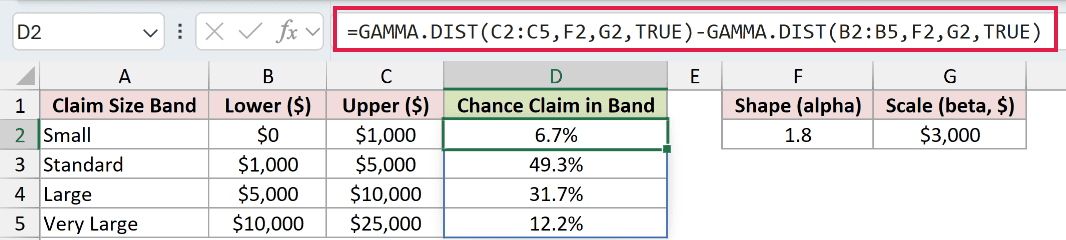
The formula spills into D2:D5. It subtracts the cumulative probability at each lower limit from the cumulative probability at the corresponding upper limit.
The Standard band, from $1,000 to $5,000, returns 49.3%. The Large band, from $5,000 to $10,000, returns 31.7%.
The Small and Very Large bands return 6.7% and 12.2%, respectively. Claims above the last upper limit aren’t included in these bands.
Both calls use TRUE because we’re subtracting accumulated areas. Subtracting density values would measure a difference in curve heights instead.
Example 5: Estimate the Chance of Missing an SLA
Missing an SLA means taking longer than the agreed time limit.
Below is the dataset. Columns A:D contain vendors, shape, scale, and service-level agreement limits; column E will hold each vendor’s probability of missing its SLA.
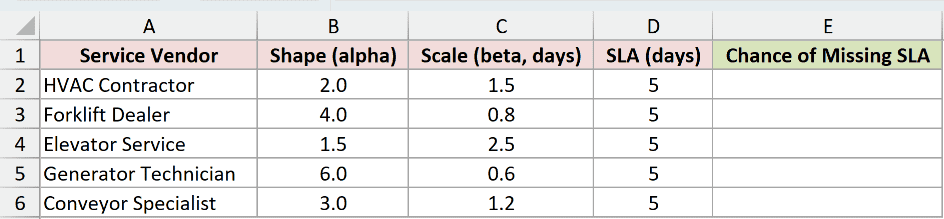
We want the probability that each vendor takes longer than the allowed service time.
Enter this formula in E2:
=1-GAMMA.DIST(D2:D6,B2:B6,C2:C6,TRUE)
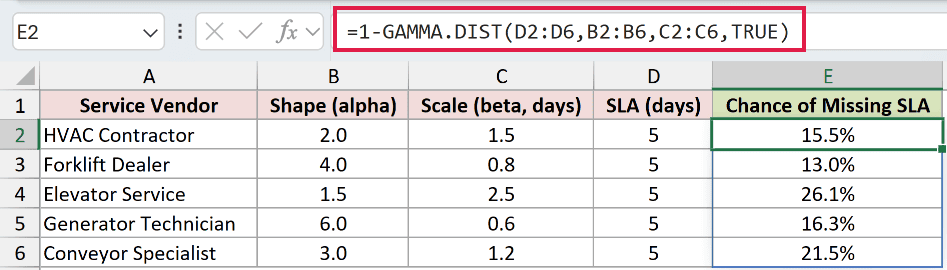
GAMMA.DIST calculates the probability of finishing within the SLA. Subtracting that probability from 1 leaves the right tail, the chance of exceeding the limit.
The formula matches the SLA, alpha, and beta from each row, then spills the answers into E2:E6.
The Forklift Dealer returns 13.0%, compared with 15.5% for the HVAC Contractor. Elevator Service has the highest modeled breach probability here, 26.1%.
There is no GAMMA.DIST.RT function. Use this subtraction pattern when your question is about values above a limit.
Example 6: Estimate Parameters From Claim Amounts
So far, the model parameters were supplied. This time, we’ll estimate them from recorded claims.
Below is the dataset. A:B lists claim IDs and amounts; D:E contains calculation labels, result cells, and a typed large-claim threshold in E6.
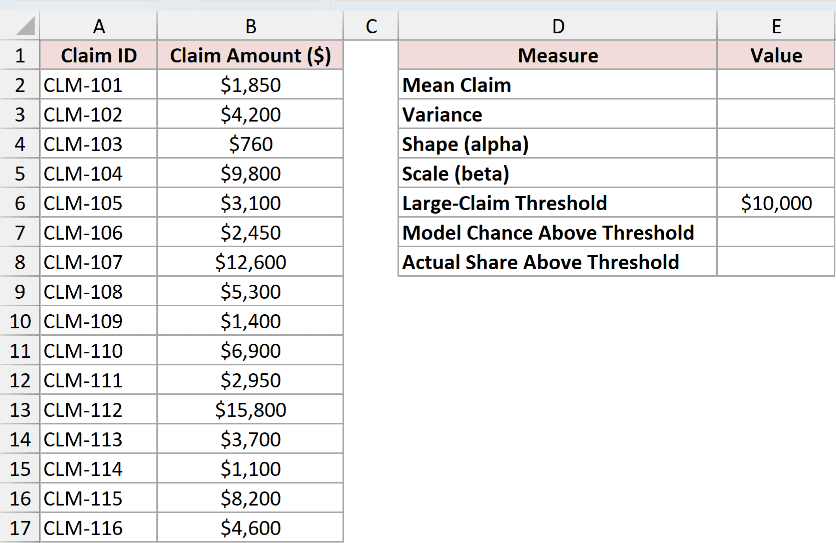
We want to estimate the gamma parameters, calculate a large-claim probability, and compare it with the observed share.
Calculate the mean in E2 with AVERAGE:
=AVERAGE(B2:B17)
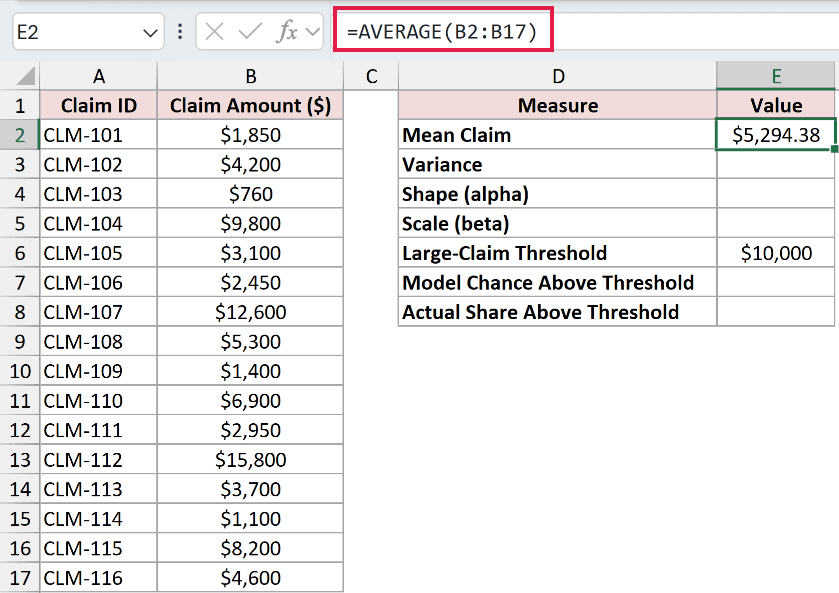
The mean claim is $5,294.38.
Calculate the sample variance in E3 with VAR.S:
=VAR.S(B2:B17)
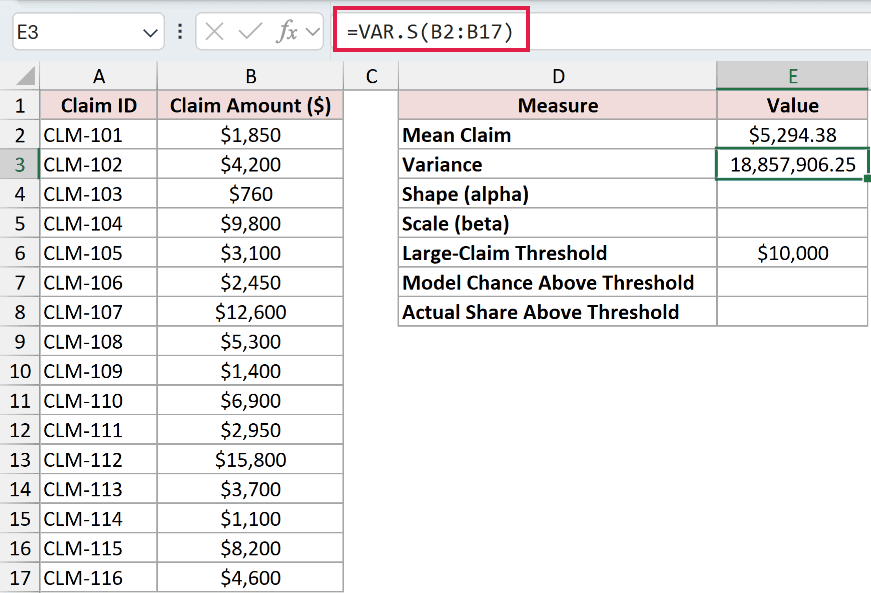
The variance is 18,857,906.25, expressed in squared dollars.
Estimate alpha in E4:
=E2^2/E3
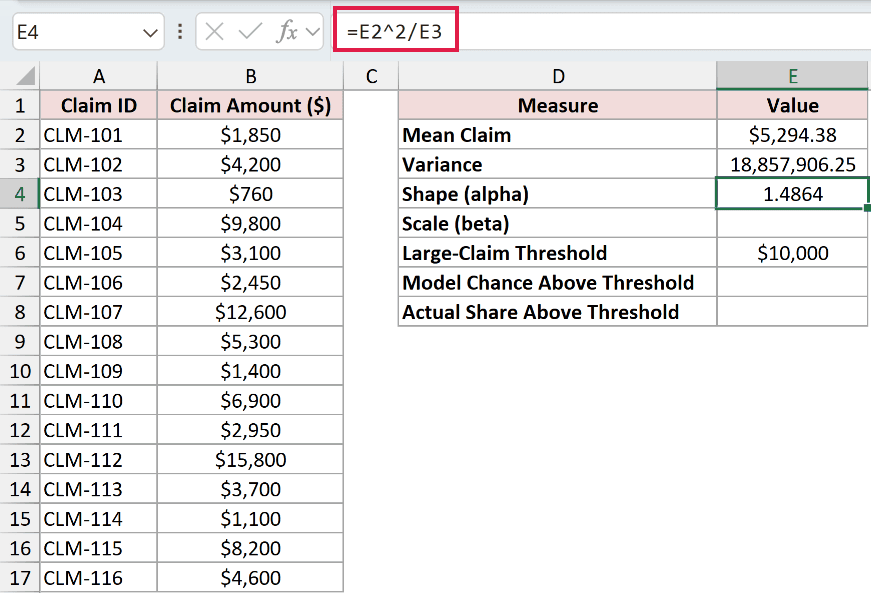
Squaring the mean and dividing by the variance returns a shape estimate of 1.4864.
Estimate beta in E5:
=E3/E2
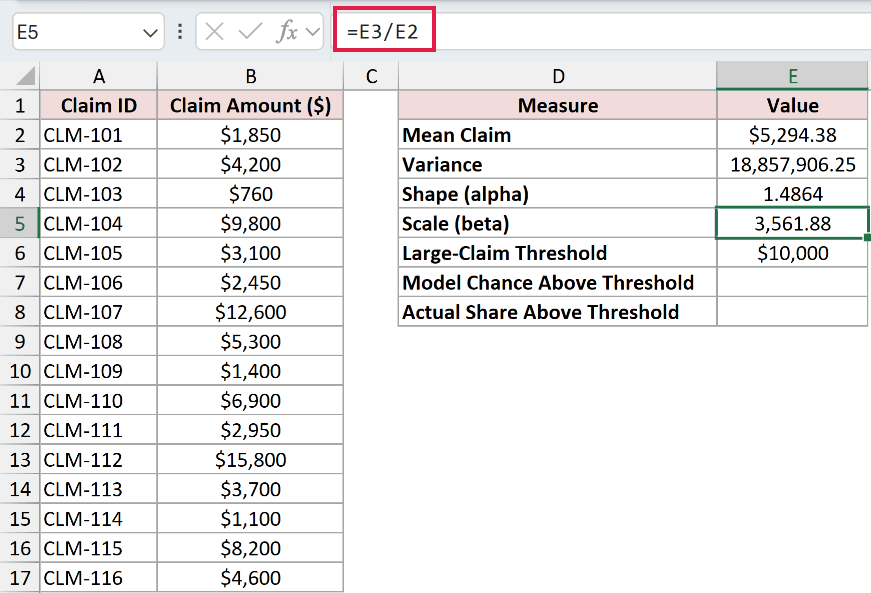
Dividing the variance by the mean returns 3,561.88. This scale is in dollars, matching the claim amounts.
Keep the cell references so later calculations use the full stored precision.
With the typed $10,000 threshold in E6, calculate the model probability in E7:
=1-GAMMA.DIST(E6,E4,E5,TRUE)
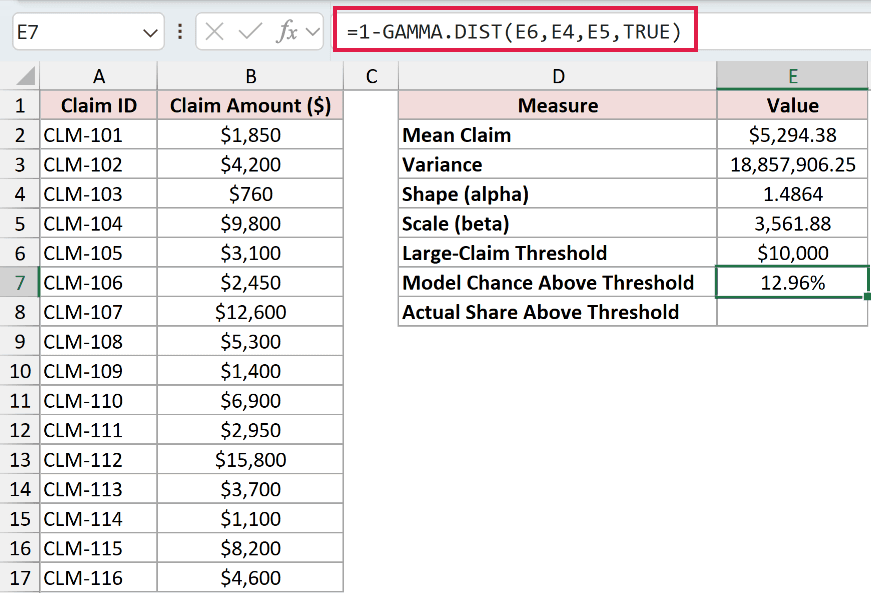
The model estimates a 12.96% chance of a claim exceeding the threshold.
For the actual-share comparison, enter this formula in E8:
=COUNTIF(B2:B17,">"&E6)/COUNT(B2:B17)
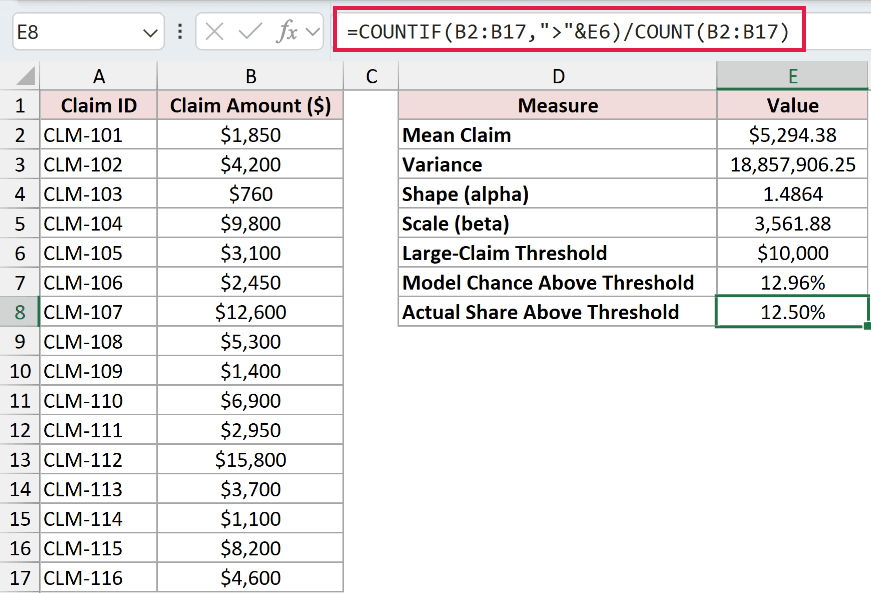
COUNTIF counts claim amounts above E6, and COUNT supplies the number of numeric claim amounts. The actual-share comparison returns 12.50%.
The E8 comparison is close to the model’s 12.96% in E7. Matching closely at this threshold doesn’t prove the model fits the full range of claim amounts.
Tips & Common Mistakes
- Choose the final argument explicitly. A blank referenced
cumulativecell silently requests density. UseTRUEwhen you need a probability at or below a limit. - Keep scale and rate separate. Beta uses the same units as
x. EXPON.DIST takes the reciprocal rate instead, as the equivalence checks show. - Check invalid inputs. Negative
x, or nonpositive alpha or beta, returns#NUM!. Nonnumeric text forxreturns#VALUE!. - Watch density at the boundary. In testing, density at
x = 0with alpha = 0.5 and beta = 6 returned#NUM!. - Allow room for spills. Occupied output cells can cause
#SPILL!. An added@applies implicit intersection, so check for it if you expected a column of results. - Recognize the chi-square special case. Setting alpha to half the degrees of freedom and beta to 2 makes the cumulative gamma result match CHISQ.DIST.
- Keep GAMMA and GAMMA.DIST separate. GAMMA returns the gamma function value. GAMMA.DIST returns a probability or density for a gamma distribution.
- Use the current name. GAMMA.DIST is available in Excel 2010 and later. GAMMADIST is the legacy name retained for compatibility.
- Use GAMMA.INV for the reverse question. It returns the value at a chosen cumulative probability when you already know the shape and scale.
Other Excel articles you may also like:
