
BMI (body mass index) compares someone’s weight with their height, and Excel can work it out for a whole list of people with one short formula.
The tricky part is units. The standard formula wants kilograms and meters, so pounds, inches, or a height written as 5 ft 7 in needs a small conversion first.
I’ll show you four ways to calculate BMI, including feet-and-inches heights and mixed units, then how to add CDC categories, color them, and find a healthy weight range.
Method #1: Using the Metric BMI Formula
The standard BMI formula divides weight in kilograms by height in meters squared. Most people record height in centimeters, so the formula converts it to meters first.
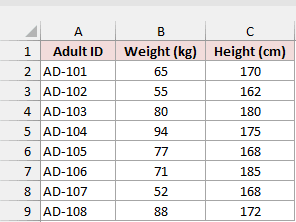
Below I have a dataset on the Metric sheet with weight in kilograms in column B and height in centimeters in column C.
I want the BMI for each adult in column D.
Here is the formula:
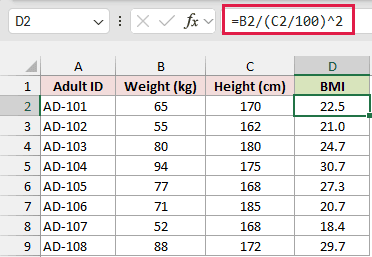
=B2/(C2/100)^2
Enter it in D2 and copy it down to D9.
How does this formula work?
C2/100 turns 170 cm into 1.7 m, and ^2 squares it. Then 65 kg is divided by that squared height, which returns 22.49.
Excel calculates the power before the division, so you don’t need extra brackets. I formatted column D to show one decimal place, so it displays 22.5.
In Excel 2021, Excel 2024, and Microsoft 365, you can also enter =B2:B9/(C2:C9/100)^2 in D2, and the results spill down the column automatically.
Method #2: Using the 703 Formula (Pounds and Inches)
If your weights are in pounds and your heights are in inches, you don’t need to convert anything by hand. Multiplying by 703 takes care of the units.
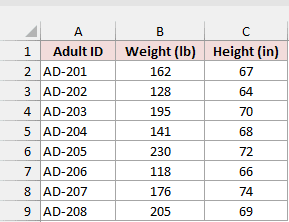
Below I have a dataset on the Pounds and Inches sheet, with weight in pounds in column B and height in inches in column C.
Here is the formula:
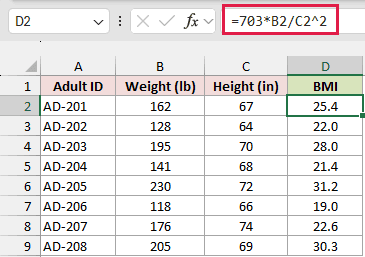
=703*B2/C2^2
Enter it in D2 and copy it down to D9.
How does this formula work?
C2^2 squares 67 inches to 4,489. Then 162 pounds times 703 is divided by that number, which returns 25.37 and displays as 25.4.
The 703 is a conversion factor. It turns pounds per square inch into the kilograms per square meter that BMI is based on.
In Excel 2021 and later, =703*B2:B9/C2:C9^2 in D2 spills the same results down the column.
Method #3: Using Separate Feet and Inches Columns
In the US, height is usually written as feet and inches, like 5 ft 7 in.
If your sheet keeps those in two columns, the formula can turn them into total inches.
Below I have a dataset on the Feet and Inches sheet.
Weight in pounds is in column B, feet are in column C, and the remaining inches are in column D.
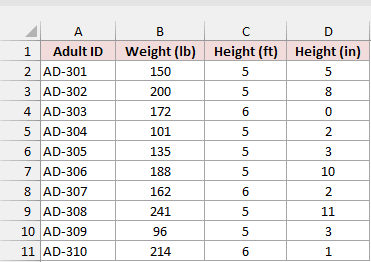
Here is the formula:
=703*B2/(C2*12+D2)^2
Enter it in E2 and copy it down to E11.
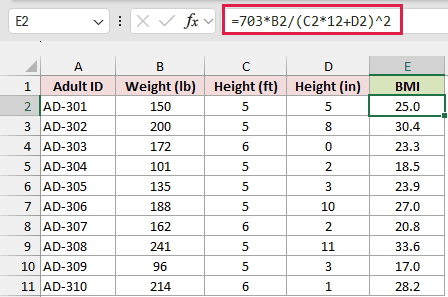
How does this formula work?
C2*12 turns 5 feet into 60 inches, and adding D2 gives 65 inches. The rest is the 703 formula from Method #2.
For AD-301, 150 lb at 5 ft 5 in returns 24.96, which displays as 25.0. For AD-303, who is exactly 6 feet, the inches cell holds 0.
Note: Don’t type 5 ft 10 in as 5.10 in one cell. Excel reads that as 5.1 feet, so a 150 lb adult gets a BMI of 28.2 instead of 21.5.
Method #4: Using the CONVERT Function for Mixed Units
Sometimes the data mixes systems, like weight in pounds from a home scale and height in centimeters from a doctor’s chart.
The CONVERT function can translate each value to metric for you.
Below I have a dataset on the Mixed Units sheet, with weight in pounds in column B and height in centimeters in column C.
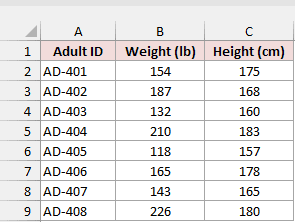
Here is the formula:
=CONVERT(B2,"lbm","kg")/CONVERT(C2,"cm","m")^2
Enter it in D2 and copy it down to D9.
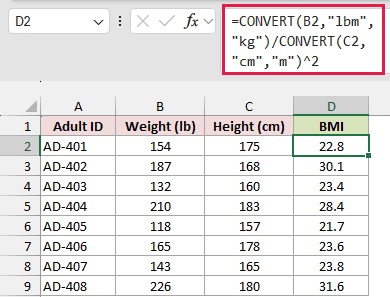
How does this formula work?
CONVERT(B2,"lbm","kg") turns 154 lb into 69.85 kg, and CONVERT(C2,"cm","m") turns 175 cm into 1.75 m. The rest is the metric formula, which returns 22.81.
To handle other units, swap the unit codes. For example, use "in" for inches or "ft" for feet.
CONVERT doesn’t accept a whole range in this formula (it returns #VALUE!), so copy it down instead of spilling it.
Note: CONVERT unit codes are case-sensitive, and pounds are “lbm” (pound mass). Both “lb” and “LBM” return #N/A.
Adding CDC BMI Categories With XLOOKUP
A BMI number is easier to read with a label next to it. The CDC groups adults aged 20 and older into four categories:
- Underweight: less than 18.5
- Healthy weight: 18.5 to less than 25
- Overweight: 25 to less than 30
- Obesity: 30 or greater
Instead of hard-coding those cutoffs in a nested IF formula, I keep them in a small table and look each BMI up with XLOOKUP.
If a cutoff changes, you edit the table, not the formula.
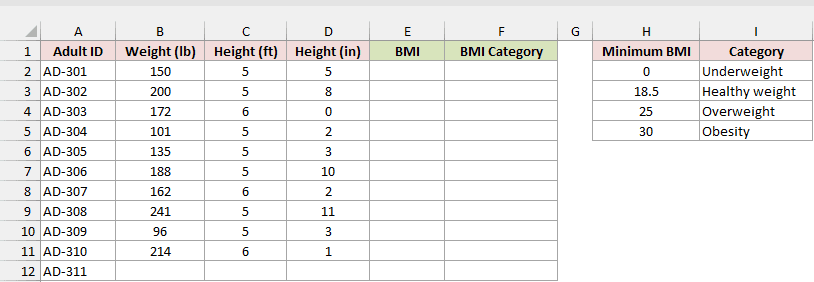
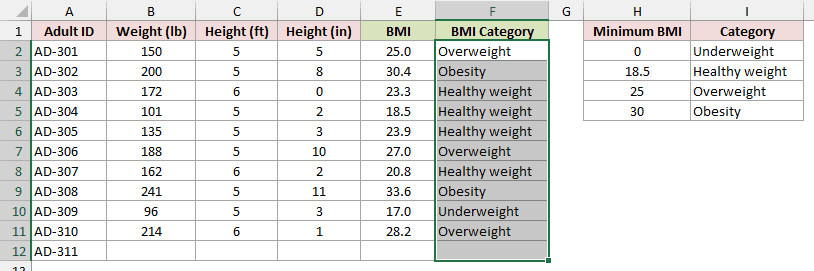
Below I have a roster on the BMI Categories sheet.
Weight is in column B, feet and inches are in columns C and D, and the cutoff table sits in H1:I5.
AD-311 hasn’t been measured yet, so that row is empty. I want the BMI in column E and the category in column F.
Start with the BMI. The Method #3 formula returns #DIV/0! on an empty row, so I’m using a version that stays blank until the weight and feet are filled in:
=IF(OR(B2="",C2=""),"",703*B2/(C2*12+D2)^2)
Enter it in E2 and copy it down to E12.
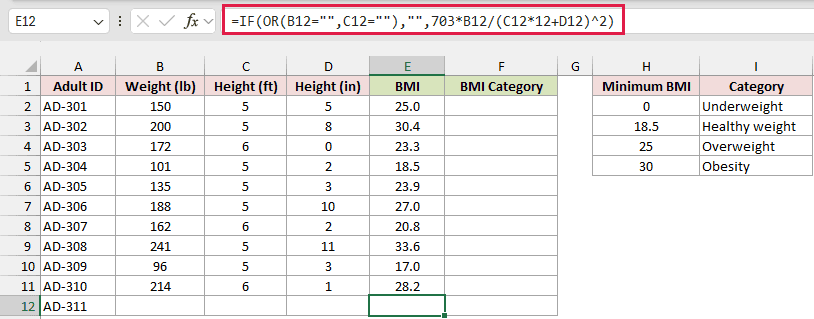
OR(B2="",C2="") checks whether the weight or the feet cell is empty. If either one is, IF returns an empty text string. Otherwise, it runs the same feet-and-inches formula.
Next, add the category with this formula:
=IF(E2="","",XLOOKUP(ROUND(E2,1),$H$2:$H$5,$I$2:$I$5,,-1))
Enter it in F2 and copy it down to F12.
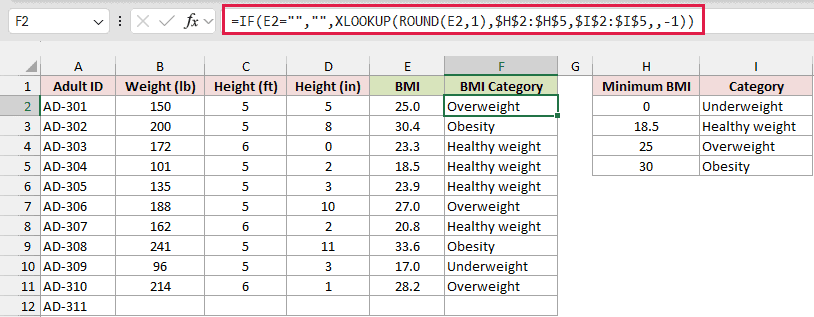
How does this formula work?
ROUND(E2,1)rounds the BMI to one decimal place, the same number you see in column E.- XLOOKUP looks that number up in the Minimum BMI column (H2:H5) and returns the matching label from I2:I5.
- The
-1tells XLOOKUP to return an exact match or the next smaller value. So 23.3 matches the 18.5 row and returns Healthy weight. IF(E2="","",...)keeps the category blank when the BMI is blank. Without it, XLOOKUP returns #VALUE! for AD-311.- The
$signs lock the cutoff table so it doesn’t move as you copy the formula down.
Rounding first matters for values near a cutoff. AD-301’s BMI is 24.96, which shows as 25.0. Without ROUND, the formula would label it Healthy weight right next to a 25.0.
Rounding keeps the label in line with the number on screen. It works the other way too: AD-304’s 18.47 shows as 18.5, so it gets Healthy weight, not Underweight.
XLOOKUP works in Excel 2021, Excel 2024, Microsoft 365, and Excel for the web. In Excel 2019 or older, use =IF(E2="","",LOOKUP(ROUND(E2,1),$H$2:$H$5,$I$2:$I$5)) instead.
LOOKUP returns the same categories, as long as the Minimum BMI column stays sorted from smallest to largest.
Note: Some online BMI formulas use <=18.5 and <=24.9 as cutoffs. The CDC’s healthy range is 18.5 to less than 25, so a BMI of exactly 18.5 is Healthy weight, not Underweight.
Color-Coding BMI Categories With Conditional Formatting
Labels are faster to scan when they have a color. Conditional formatting fills each category cell automatically, and the color updates whenever a BMI changes.
Below I have the same roster on the BMI Categories sheet, with the BMI in column E and the category in column F.
I want Healthy weight in green, Underweight and Overweight in yellow, and Obesity in red.
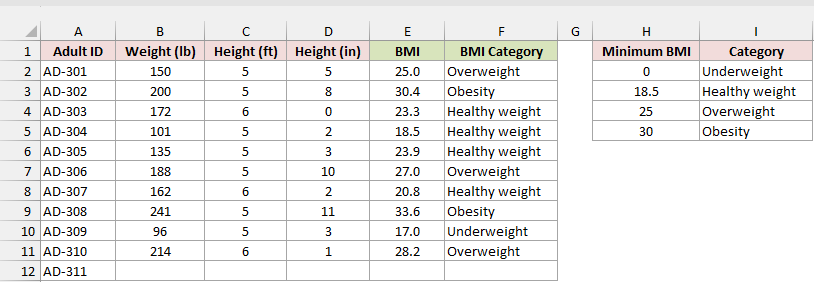
Here are the steps to color-code the categories:
- Select F2:F12.
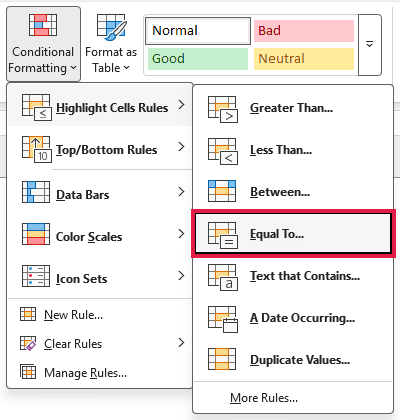
- On the Home tab, click Conditional Formatting, then Highlight Cells Rules, then Equal To.
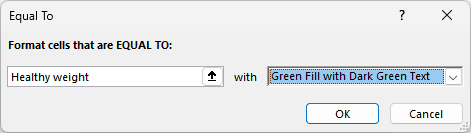
- In the Equal To dialog, type Healthy weight in the box, pick Green Fill with Dark Green Text from the drop-down, and click OK.
- Repeat steps 2 and 3 for Underweight and Overweight with Yellow Fill with Dark Yellow Text, and for Obesity with Light Red Fill with Dark Red Text.
Each category cell now shows its color. AD-311’s empty cell stays white because it doesn’t match any of the rules.
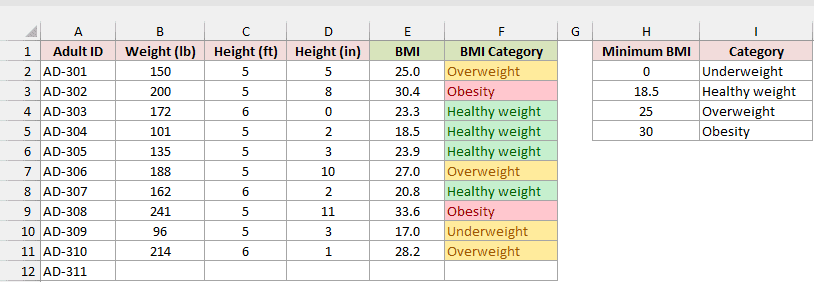
Equal To matches the whole cell, so the text you type in the dialog has to match the label exactly.
Finding the Healthy Weight Range for a Height
You can also run the BMI formula backwards to find the weight range that counts as healthy for a height.
Multiply the target BMI by height squared, then divide by 703.
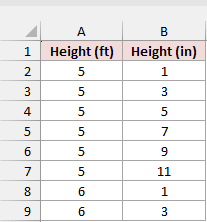
Below I have a list of heights on the Healthy Weight Range sheet, with feet in column A and inches in column B.
Here is the formula for the lowest healthy weight:
=18.5*(A2*12+B2)^2/703
Enter it in C2 and copy it down to C9.
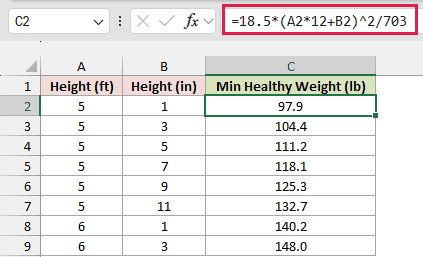
A2*12+B2 gives the height in inches (61 for 5 ft 1 in). Squaring it, multiplying by 18.5, and dividing by 703 returns 97.9 lb.
And here is the formula for the highest healthy weight:
=24.9*(A2*12+B2)^2/703
Enter it in D2 and copy it down to D9.
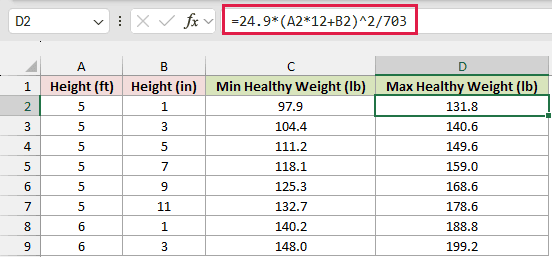
It’s the same formula with 24.9 in place of 18.5.
I used 24.9 because it’s the top of the healthy range at one decimal place, which matches how the category formula rounds.
At 5 ft 5 in, the healthy range runs from 111.2 lb to 149.6 lb. That’s why AD-301, at 150 lb and 5 ft 5 in, lands in Overweight.
If you work in metric, use =18.5*(C2/100)^2 and =24.9*(C2/100)^2 with height in centimeters in C2. At 170 cm, that’s 53.5 kg to 72.0 kg.
Additional Notes About Calculating BMI in Excel
- Forgetting to convert centimeters to meters:
=B2/C2^2returns 0.0022 for 65 kg and 170 cm instead of 22.5. - Not squaring the height:
=B2/(C2/100)returns 38.2 instead of 22.5. - Using a formula for the wrong units: the metric formula on 154 lb and 175 cm returns 50.3. It looks like a real BMI, but it isn’t.
- A number format only changes what you see. Column E still holds 24.96 when it shows 25.0, which is why the category formula rounds first.
- BMI is a screening measure, not a diagnosis, and the CDC categories here are for adults aged 20 and older.
Frequently Asked Questions
Here are answers to a few common questions about calculating BMI in Excel.
Why do you multiply by 703 in the BMI formula?
703 converts pounds per square inch into kilograms per square meter. The exact factor is 703.07, and 703 is the standard rounded version.
The difference is tiny. For AD-301, the CONVERT version returns 24.961 and the 703 version returns 24.959, and both show 25.0.
How do I count how many people are in each BMI category?
Use COUNTIF on the category column. On the BMI Categories sheet, =COUNTIF(F2:F12,"Healthy weight") returns 4. Change the text to count the other categories.
How do I add obesity classes to the BMI category formula?
The CDC splits obesity into Class 1 (30 to less than 35), Class 2 (35 to less than 40), and Class 3 (40 or greater).
Rename the 30 row to Obesity Class 1, add rows for 35 and 40 below it, and extend the XLOOKUP ranges to $H$2:$H$7 and $I$2:$I$7.
Then add a color rule for each new label.
Can I use these BMI categories for children?
No. The CDC categories are for adults aged 20 and older. Children’s and teens’ BMI is read with age- and sex-specific percentiles instead.
Does the BMI formula work in Google Sheets?
Yes. The metric, 703, and feet-and-inches formulas are plain arithmetic, and Google Sheets has XLOOKUP with the same -1 match mode, so the category formula works too.
Conclusion
Calculating BMI in Excel comes down to weight divided by height squared, with the right conversion for your units.
Start with the metric formula, and use CONVERT when your units are mixed.
From there, a small cutoff table and XLOOKUP add the CDC categories. I hope you found this article helpful.
