
If you have the same kind of data split across several tables, like one table per store or per month, appending them in Power Query stacks all those rows into one combined table.
The nice part is that the combined table comes from a query. When the source tables get new rows, a refresh pulls them in.
The catch is that Power Query lines up columns by their header names, not by position. A header that’s spelled differently in one table doesn’t get matched, and you end up with extra columns full of nulls.
In this article, I’ll show you how to append two or more tables with Append Queries as New, how to add rows to an existing query with Append Queries, and how to do it with the Table.Combine function.
I’ll also show you how to fix columns that don’t match.
Method #1: Using Append Queries as New
Append Queries as New creates a brand-new query that holds the stacked rows. Your original queries stay exactly as they were, so you can keep using them elsewhere.
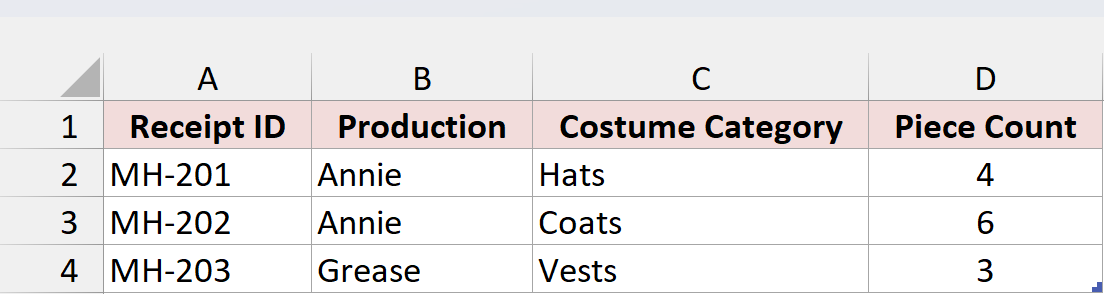
Below I have the costume returns logged at a theater venue called Maple Hall. Each row has a receipt ID, the production the costume came from, the costume category, and the number of pieces returned.
And here are the returns from a second venue, River Stage. It has the same four columns, but in a different order.
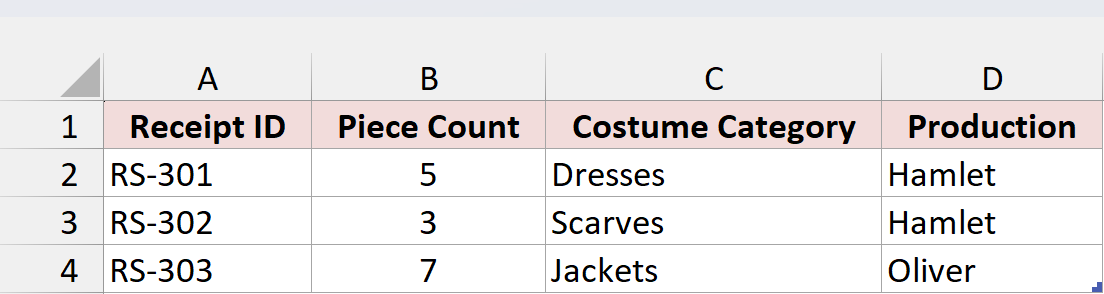
I want to stack both tables into one table with all six returns. Both datasets are already formatted as Excel Tables, named MapleHall and RiverStage. If yours aren’t, click inside the data and press Ctrl + T first.
Here are the steps to append these two tables:
- Click any cell in the Maple Hall table, then go to the Data tab and click From Table/Range. The Power Query Editor opens with a query called MapleHall.

- On the Home tab, click the Close & Load drop-down and choose Close & Load To. In the Import Data dialog box, select Only Create Connection and click OK.
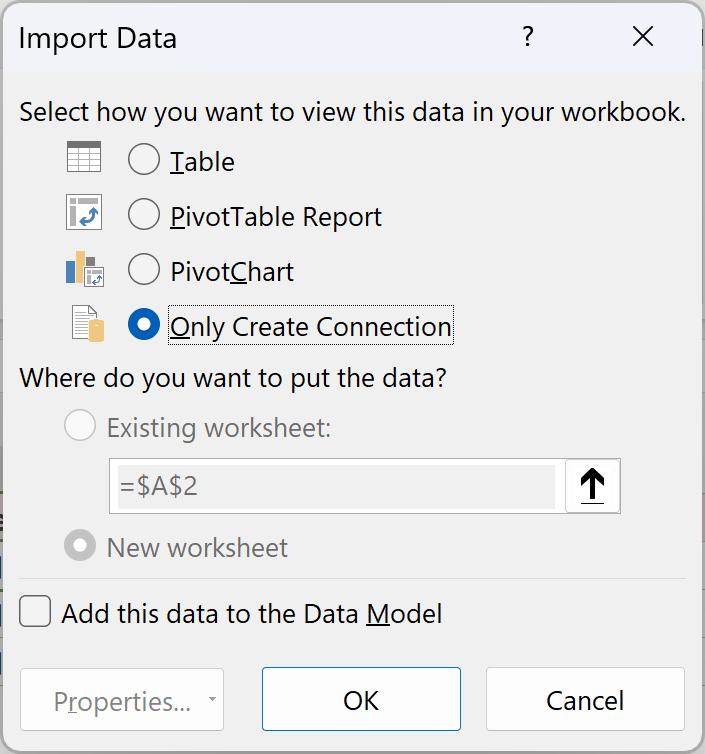
- Repeat steps 1 and 2 for the River Stage table. You now have two connection-only queries, MapleHall and RiverStage.
- Go to the Data tab, click Get Data, and choose Launch Power Query Editor. In the Queries pane on the left, click MapleHall.
- On the Home tab, click the small arrow on the Append Queries button and choose Append Queries as New.
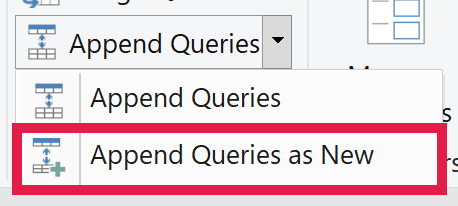
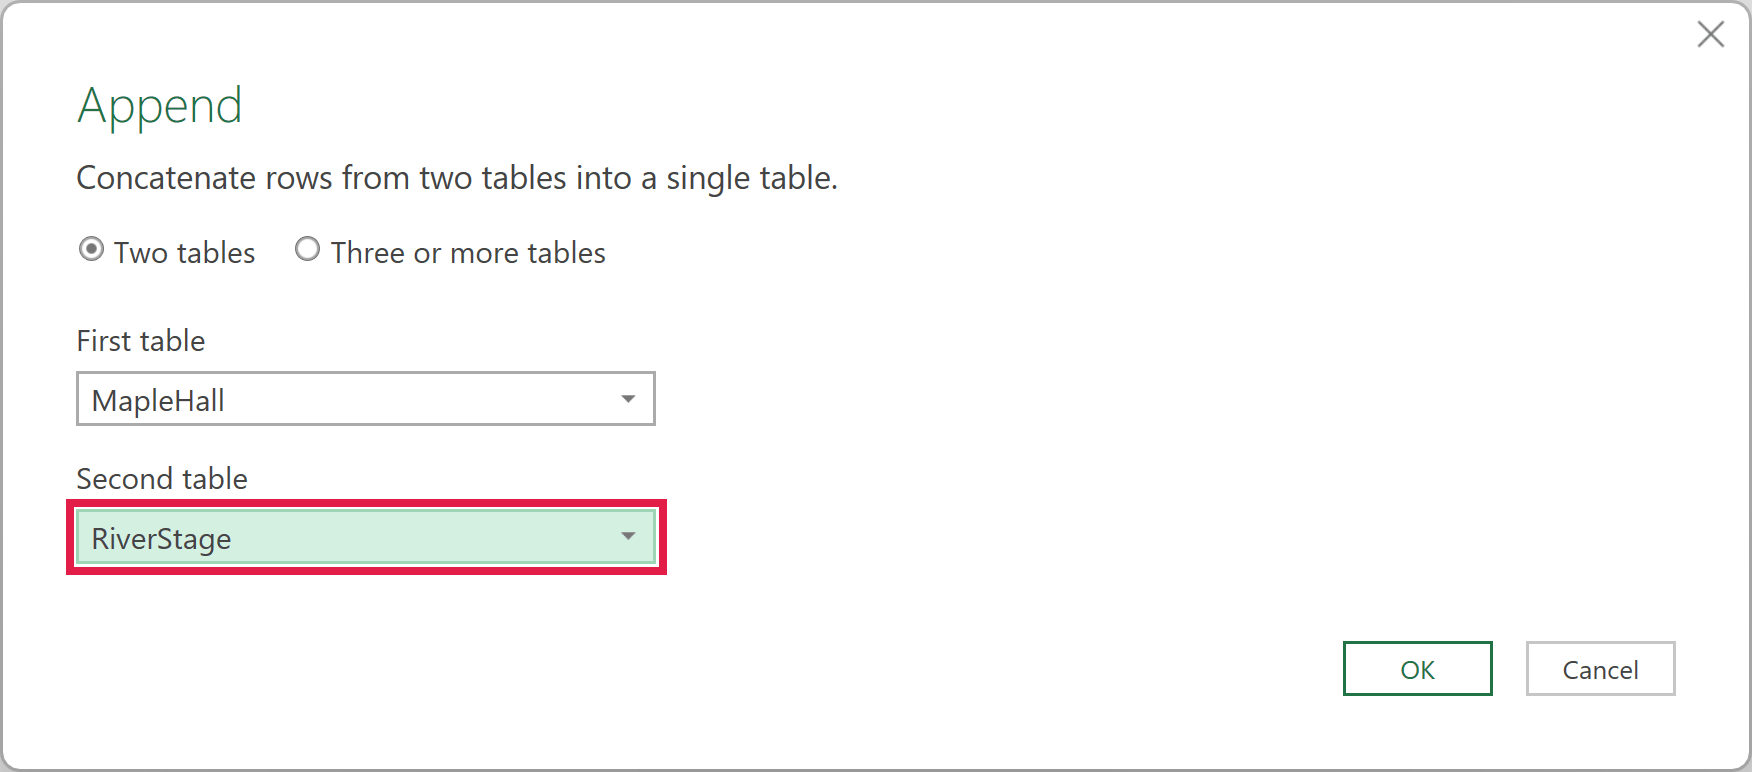
- In the Append dialog box, keep Two tables selected. Pick MapleHall as the first table and RiverStage as the second table, then click OK.
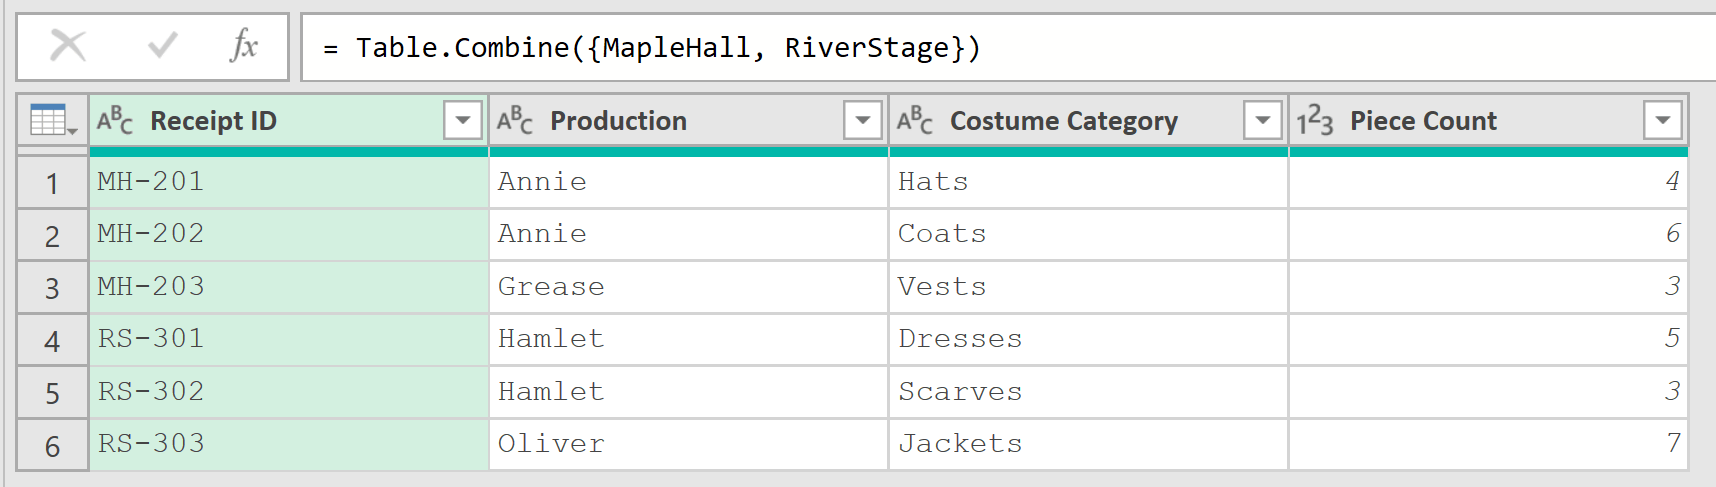
Power Query creates a new query called Append1 with all six returns. Notice that the River Stage rows landed in the right columns even though that table had its columns in a different order.
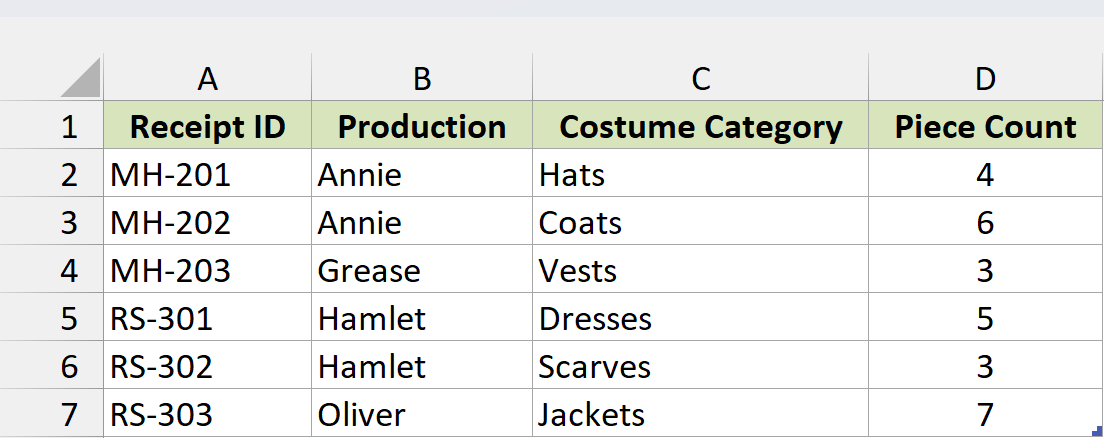
- On the Home tab, click Close & Load. Excel loads the combined table to a new worksheet.
Note: You can skip opening the editor for the append itself. Go to Data > Get Data > Combine Queries > Append, and Excel opens the same Append dialog box and creates a new Append1 query, just like Append Queries as New.
Appending Three or More Tables
The same dialog box handles more than two tables. You only need to switch to a different option at the top.
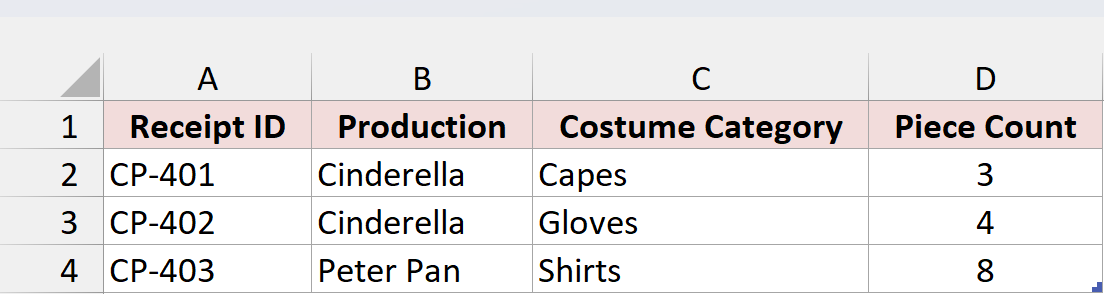
Here’s a third venue, Civic Playhouse, with the same four columns. I’ve already loaded it as a connection-only query called CivicPlayhouse, using steps 1 and 2 above.
Here are the steps to append all three tables:
- In the Power Query Editor, click the arrow on Append Queries and choose Append Queries as New.
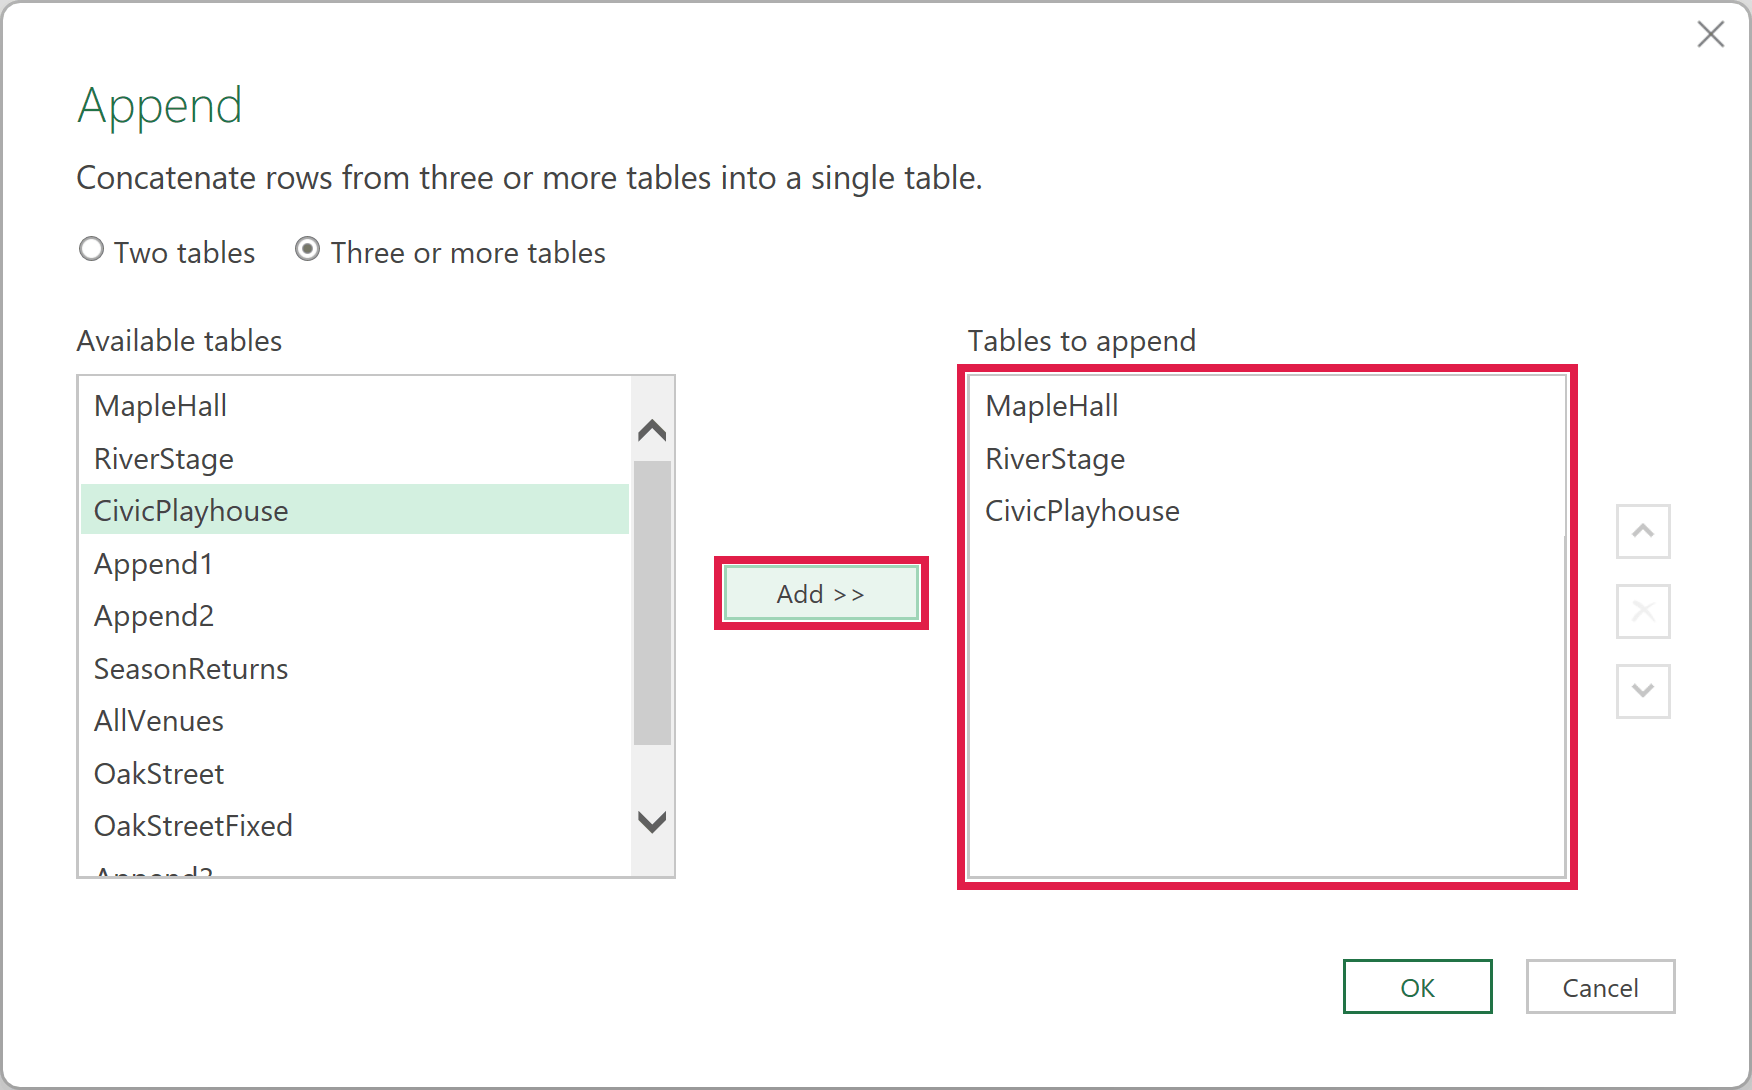
- Select Three or more tables. MapleHall is already in the Tables to append list because it’s the query you started from. In the Available tables list, select RiverStage and click Add, do the same for CivicPlayhouse, then click OK.
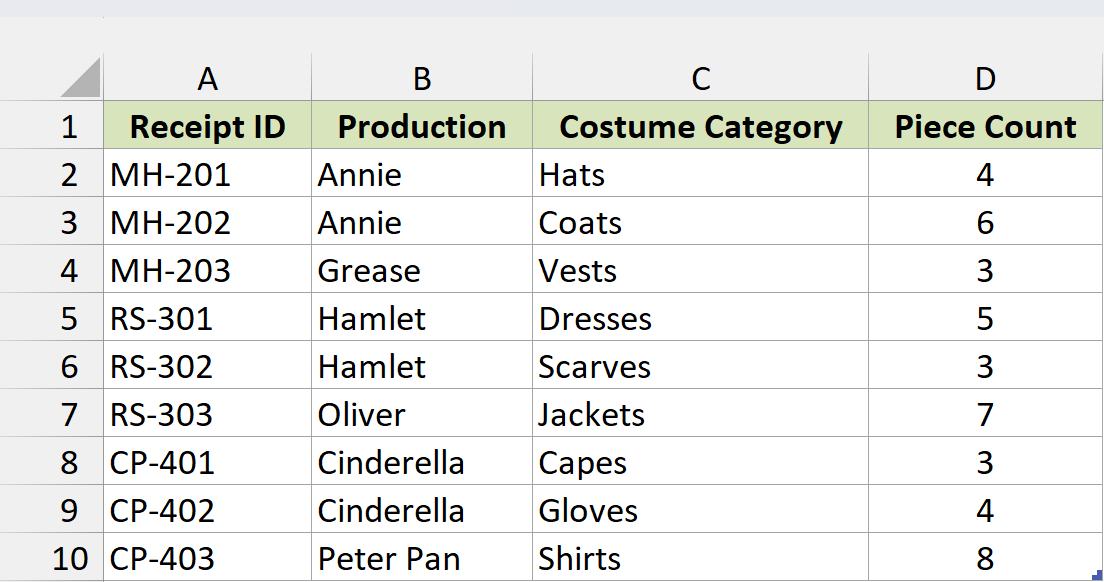
- Click Close & Load. The new Append2 table has all nine returns, in the order the tables appear in the Tables to append list.
Method #2: Using Append Queries
If you already have a query you’ve been working with and just want more rows tacked onto it, use Append Queries instead. It doesn’t create a new query. It adds an append step to the query you have open.
Below I have a query called SeasonReturns that pulls in the three Maple Hall returns. I want to add the Civic Playhouse returns to it, and the CivicPlayhouse query already exists as a connection-only query.

Here are the steps to append rows to this existing query:
- Go to Data > Get Data > Launch Power Query Editor and click SeasonReturns in the Queries pane.
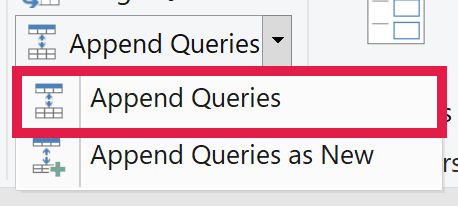
- On the Home tab, click the arrow on the Append Queries button and choose Append Queries.
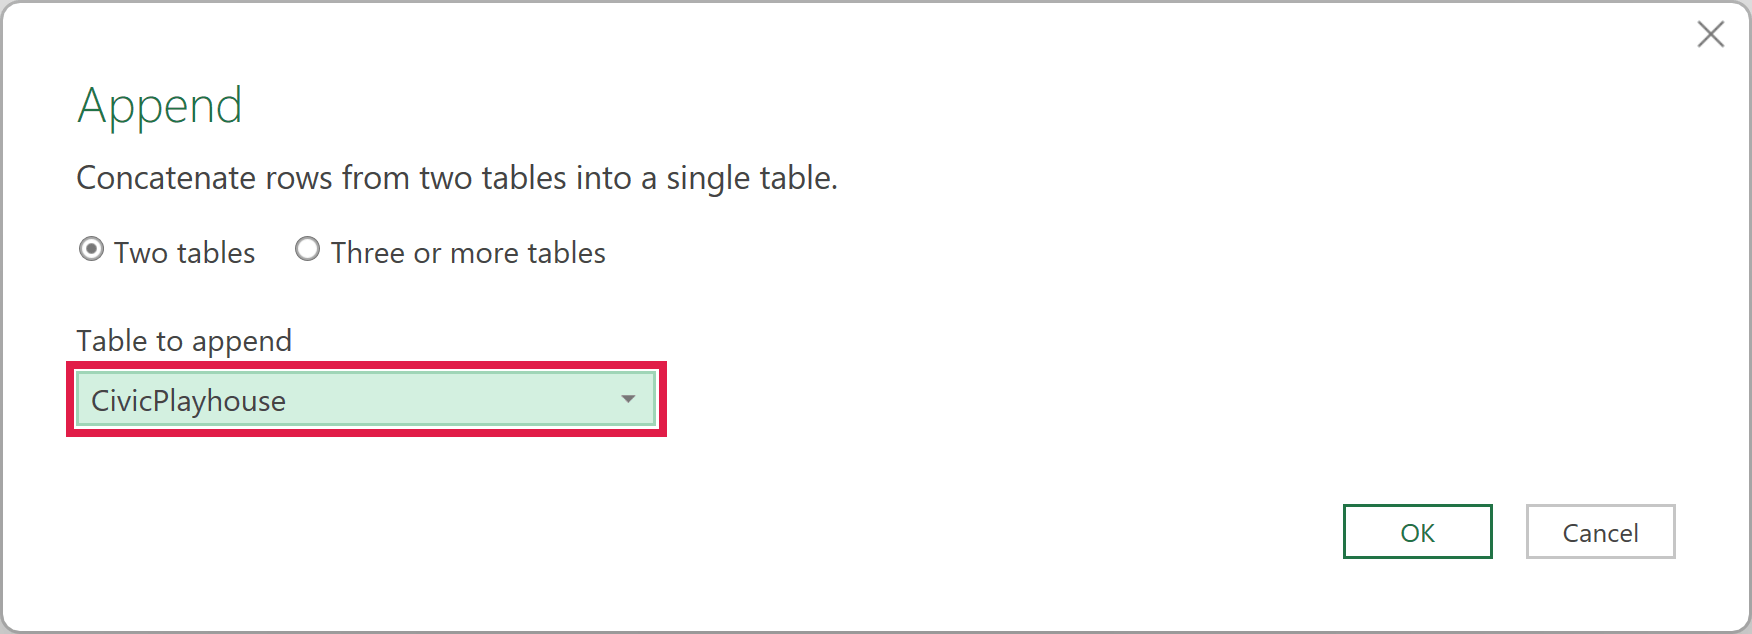
- In the Append dialog box, keep Two tables selected, pick CivicPlayhouse as the table to append, and click OK.
Power Query adds a new step called Appended Query to SeasonReturns. Its formula uses Table.Combine to stack the Civic Playhouse rows under the Maple Hall rows, so the query now has six rows.
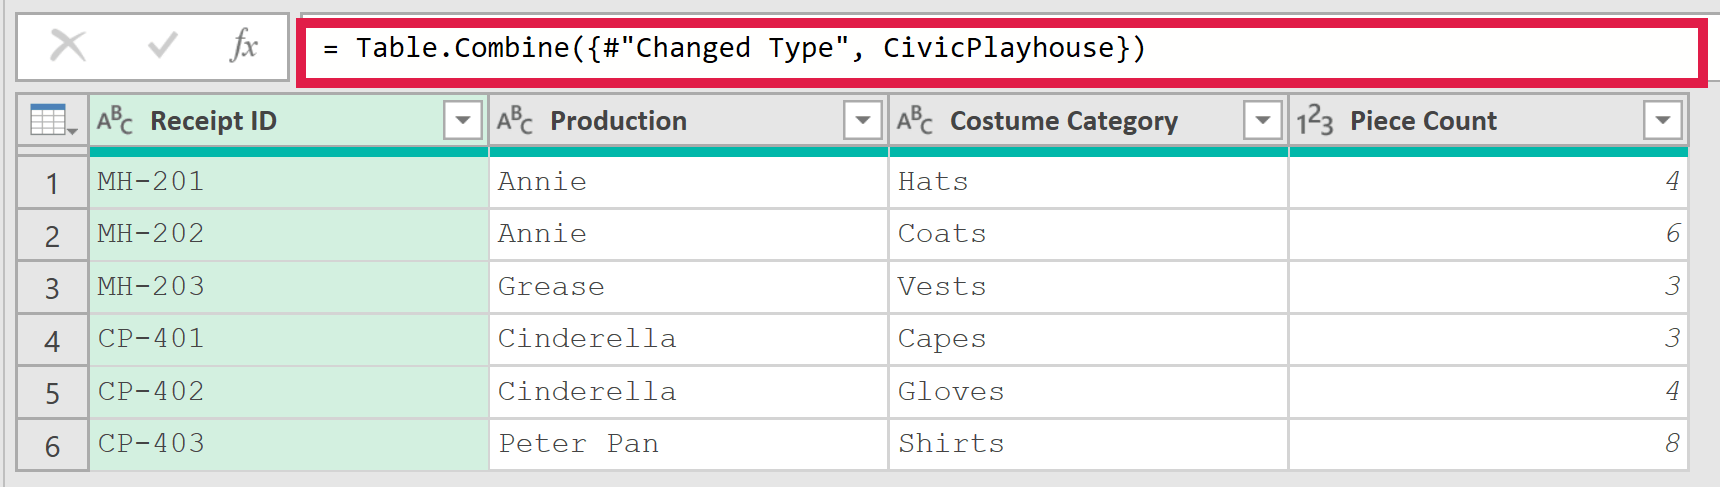
- Click Close & Load. If SeasonReturns was already loaded to a sheet, that same table updates with the new rows.
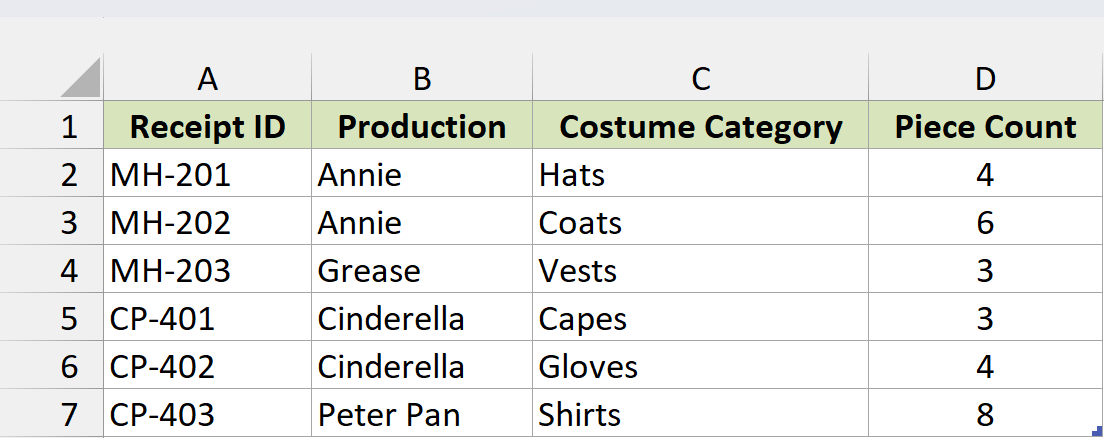
Note: Don’t use Append Queries on a query that other queries depend on. If Append1 is built from MapleHall and you append rows directly into MapleHall, those rows flow into Append1 too and you end up with duplicates.
Method #3: Using the Table.Combine Function
If you’re comfortable typing a bit of M code, you can append queries with a single line. It’s the same code Append Queries as New writes for you behind the scenes.
I’ll use the same three connection-only queries from Method #1: MapleHall, RiverStage, and CivicPlayhouse. You can see them in the Queries & Connections pane. Each one holds three costume returns, and I want all nine in one table.
Here are the steps to append them with Table.Combine:
- Go to the Data tab, click Get Data, choose From Other Sources, and click Blank Query. The Power Query Editor opens with an empty query.
- Type the formula below in the formula bar and press Enter.
= Table.Combine({MapleHall, RiverStage, CivicPlayhouse})
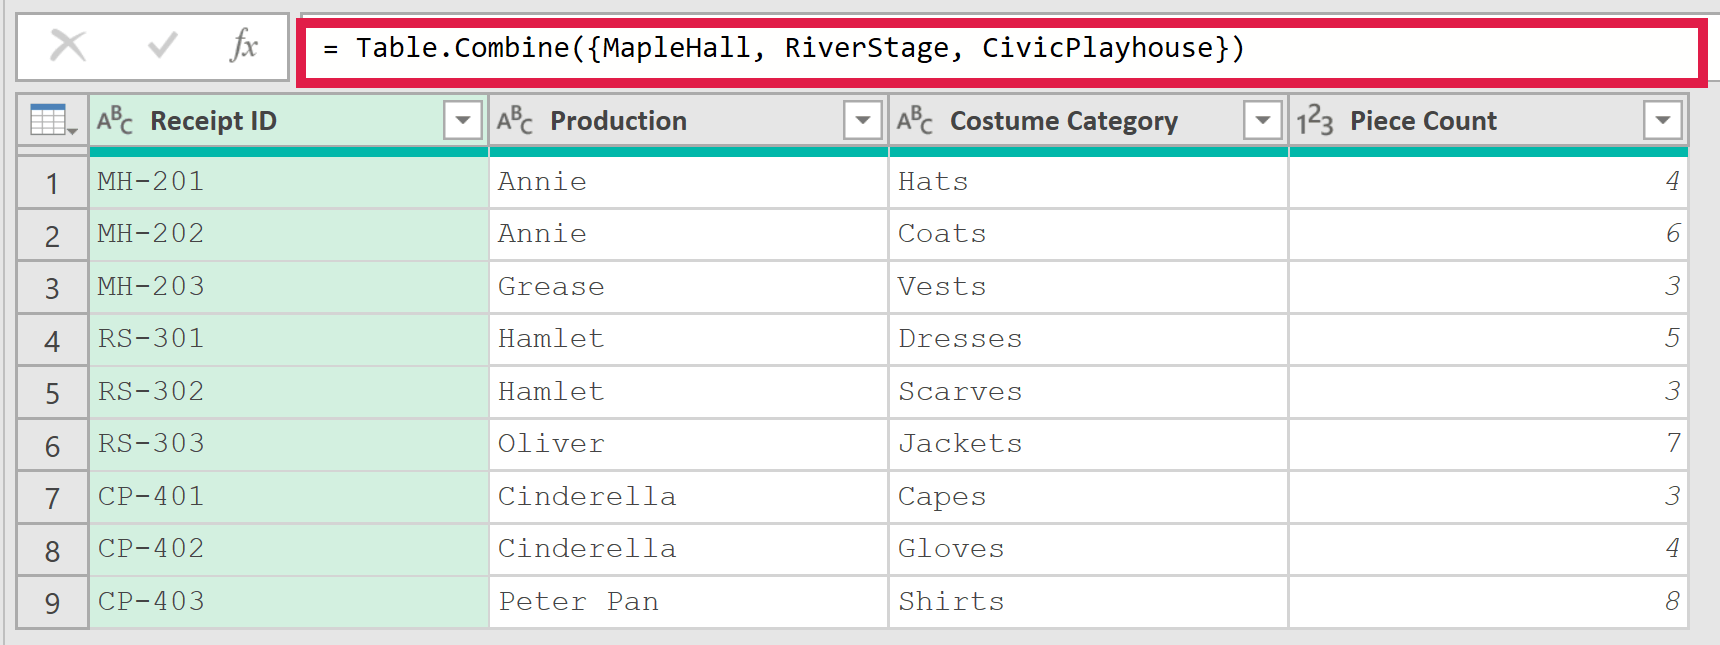
- In the Query Settings pane, type AllVenues in the Name box, then click Close & Load.
How does this formula work?
Table.Combine takes a list of tables and stacks their rows in the order you list them. The curly brackets make that list, and each name inside is one of your existing queries.
Want to add a fourth table later? Just add its query name to the list. You can read more about the arguments in the Table.Combine function guide.
What Happens When Column Names Don’t Match
Power Query only lines up columns that have exactly the same header. When one table names a column differently, you get both columns in the result, with nulls wherever a table didn’t have that column.
Here’s a fourth venue, Oak Street. Its last column is called Pieces instead of Piece Count.
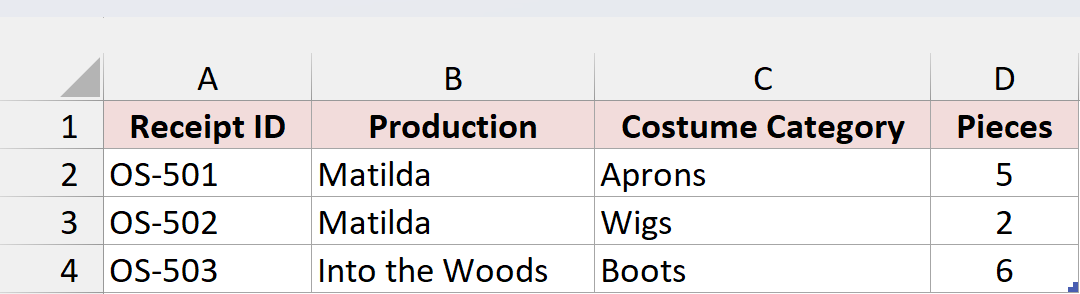
If I append MapleHall and OakStreet as they are, I get five columns. Piece Count is null for the Oak Street rows, and Pieces is null for the Maple Hall rows.
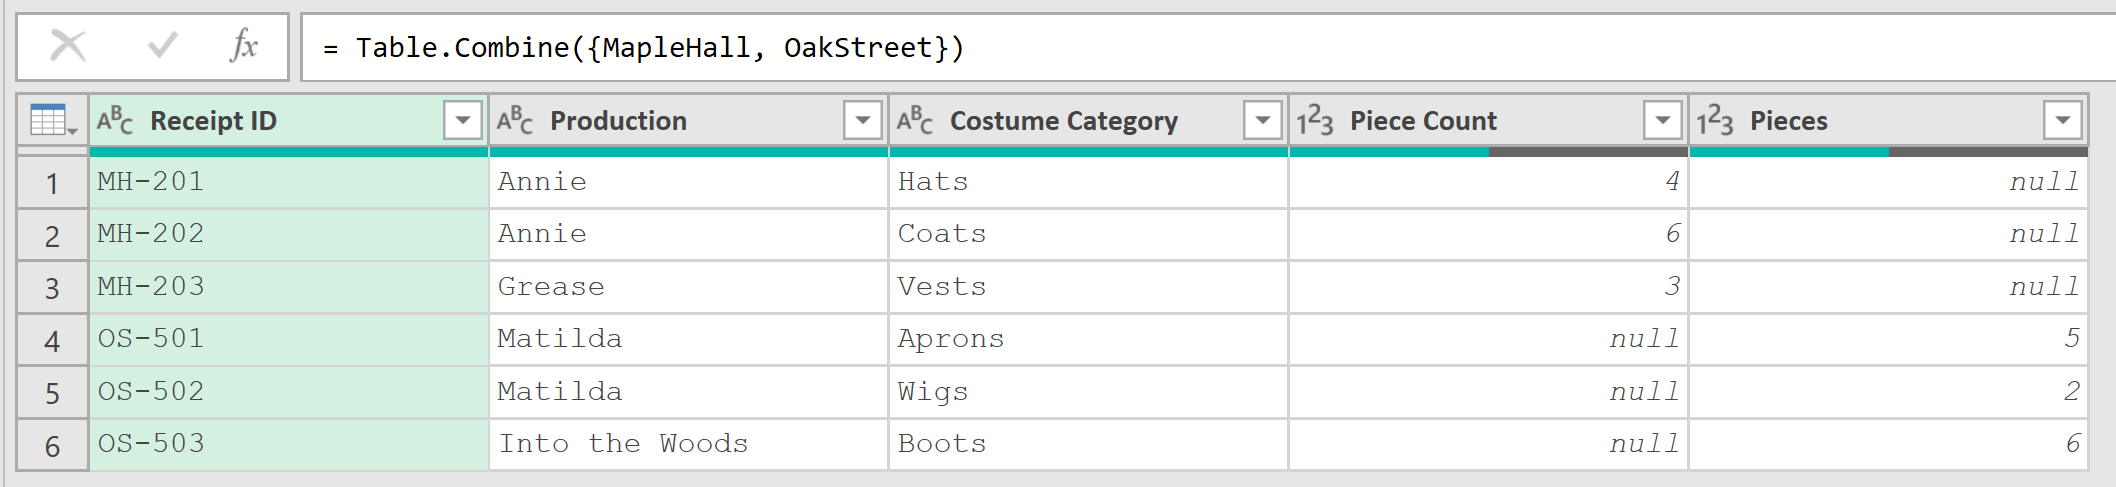
The fix is to rename the column in the source query before the append. Here are the steps:
- In the Power Query Editor, click the OakStreet query in the Queries pane.
- Double-click the Pieces column header, type Piece Count, and press Enter. Power Query adds a Renamed Columns step.

- Click the appended query (Append3 in my case). The preview now shows four clean columns, with every piece count in the same column.
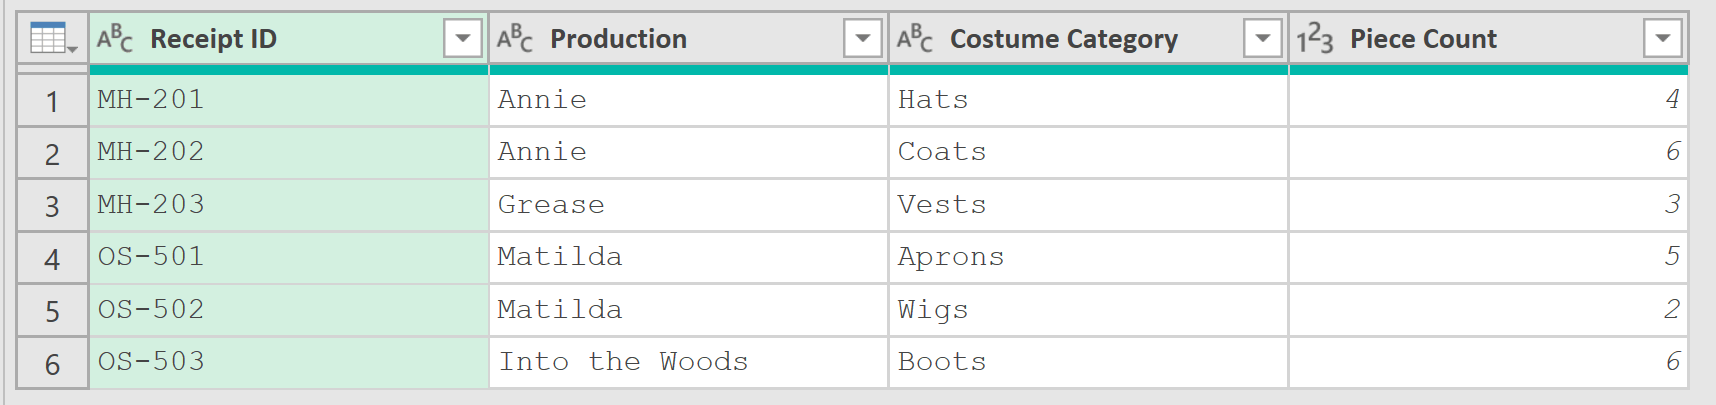
The same thing happens with small differences you can’t easily see, like a trailing space or “Piece count” with a lowercase c. If an append gives you a mystery extra column, compare the headers character by character.
Additional Notes About Appending Queries in Excel
- Refreshing is manual. When you add rows to a source table, click Data > Refresh All and the appended table picks them up.
- A brand-new table doesn’t join the append on its own. You have to load it as a query and add it to the append (or to the Table.Combine list).
- The column order in the result follows the first table you pick. Columns that only exist in later tables are added at the end.
- Append keeps every row, including duplicates. If the same receipt shows up in two tables, it shows up twice in the result.
- If you don’t need a refreshable query, the VSTACK function (Microsoft 365 and Excel 2024) stacks ranges with a formula. It matches columns by position, not by header name.
- I used Excel for Microsoft 365 on Windows. Excel for Mac and older Windows versions can show slightly different menu names.
Frequently Asked Questions
Here are some questions people often ask about appending queries.
What is the difference between Append Queries and Merge Queries?
Append stacks rows from tables that share the same columns, so the result gets taller. Merge Queries matches rows on a shared key, like an ID, and adds columns, so the result gets wider.
Does appending queries remove duplicate rows?
No. Every row from every table is kept. To remove repeats, select the columns in the appended query and use Home > Remove Rows > Remove Duplicates.
Can I append tables that have a different number of columns?
Yes. Power Query keeps every column from every table. Rows from a table that doesn’t have a column get null in that column.
Can I append every table in the workbook automatically?
Yes, with a blank query that uses Excel.CurrentWorkbook(), which lists every table in the file. Just remember that loaded query outputs are tables too, so filter by table name or your combined table ends up appending itself on the next refresh.
Conclusion
When your tables share the same columns, appending them in Power Query gives you one table you can refresh instead of pasting rows by hand.
In this article, I showed you how to append queries with Append Queries as New, Append Queries, and the Table.Combine function, plus how to fix headers that don’t match.
For most cases, I’d go with Append Queries as New, since it leaves your source queries untouched.
I hope you found this article helpful.
Other Excel articles you may also like: