
Excel’s BINOM.DIST.RANGE function returns the probability that the number of successes in a set number of trials either equals one value or falls within an inclusive range of success counts.
Each trial has the same success probability. You can find the probability of an exact count, at most a count, at least a count, or a range between two counts.
In this article, I’ll show you exact, at-most, and at-least probabilities from one quiz table, evaluate bonus tiers, test service targets, and find how many attempts you need.
BINOM.DIST.RANGE Function Syntax in Excel
The BINOM.DIST.RANGE function uses three required arguments and one optional upper limit.
=BINOM.DIST.RANGE(trials,probability_s,number_s,[number_s2])
- trials (required) is the number of independent trials.
- probability_s (required) is the probability of success on each trial, from 0 to 1.
- number_s (required) is the exact success count or the lower limit of the range.
- number_s2 (optional) is the upper limit of the range. When omitted, Excel calculates the probability of exactly
number_ssuccesses.
Both limits are included. Unlike BINOM.DIST, this function puts trials first and has no cumulative argument.
When to Use BINOM.DIST.RANGE Function
- Calculate the probability of an exact number of successes.
- Find the chance of no more than or at least a target count.
- Measure the probability that results fall between two inclusive limits.
- Compare several probability bands, such as sales bonus tiers.
- Test how many trials are needed to reach a target probability.
Example 1: Probability Between Two Values
Let’s start with the function’s four-argument range form.
Below is the dataset. The card lists delivered orders, review rate, and the lower and upper review limits. An empty bordered result cell sits beside the final label.
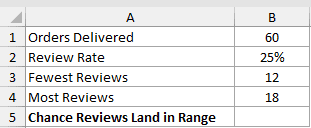
We want the probability that 12 through 18 of the 60 delivered orders receive a review.
Here is the formula:
=BINOM.DIST.RANGE(B1,B2,B3,B4)
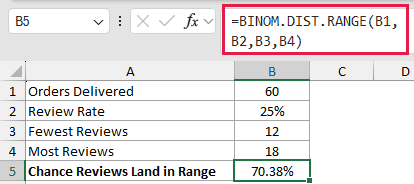
The formula returns 70.38%. Excel includes both 12 and 18 in the calculation, so you don’t need to adjust either boundary.
Example 2: Exactly, At Most, and At Least
This example uses one quiz to compare three common probability questions.
Below is the dataset. It lists scores from 0 through 10, three green result headers with empty bordered cells below, and settings for 10 questions with a 25% guessing chance.
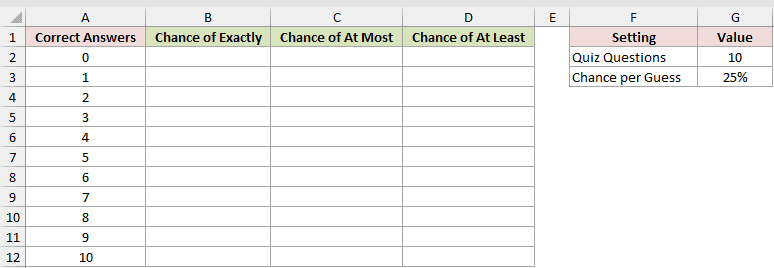
We want the exact, at-most, and at-least probability for every possible score.
Here is the formula for the exact probabilities:
=BINOM.DIST.RANGE($G$2,$G$3,A2:A12)
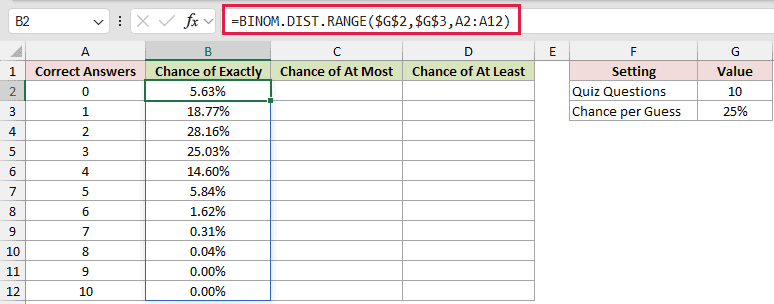
Next, this formula sets the lower limit to 0 for the at-most probabilities:
=BINOM.DIST.RANGE($G$2,$G$3,0,A2:A12)
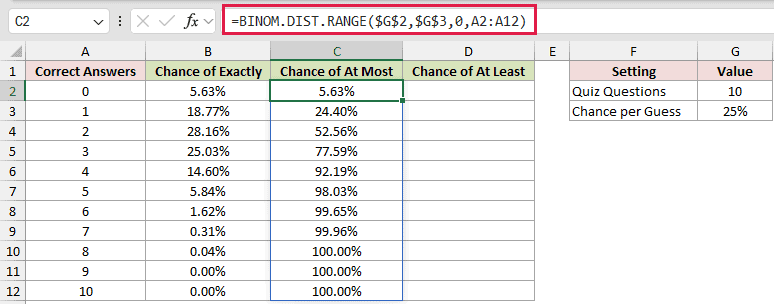
Finally, this formula uses the total question count as the upper limit for the at-least probabilities:
=BINOM.DIST.RANGE($G$2,$G$3,A2:A12,$G$2)
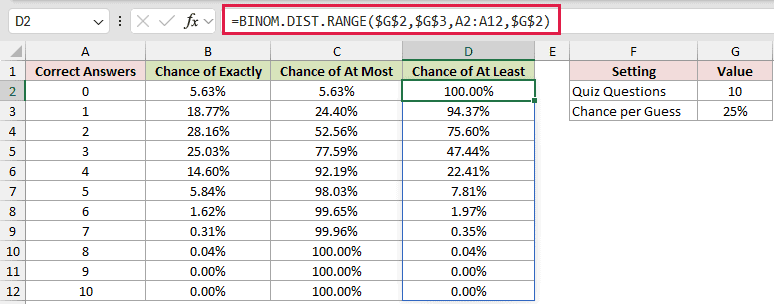
Each formula spills down 11 rows. The chance of guessing at least 6 correct answers is 1.97%, shown in D8.
These spills work in Excel 2021, Excel 2024, and Microsoft 365. Excel 2019 and earlier need single-row formulas copied down.
Pro Tip: In Excel 2021, Excel 2024, and Microsoft 365, =BINOM.DIST.RANGE(G2,G3,SEQUENCE(G2+1,1,0)) can create the complete exact-probability distribution without a typed outcome list.
Example 3: Calculate Bonus Tier Probabilities
Here’s a sales plan where each tier covers a range of deal counts and maps that range to one bonus.
Below is the dataset. It shows five bonus tiers with deal limits and payouts, a green probability header with empty bordered cells, two settings, and an empty expected-bonus cell.

First, we want the probability of landing in each bonus tier.
Here is the formula:
=BINOM.DIST.RANGE($H$2,$H$3,B2:B6,C2:C6)
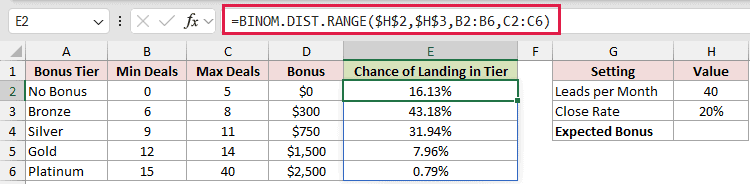
The lower and upper ranges pair row by row. Bronze, covering 6 through 8 deals, has the highest probability at 43.18%.
Next, we want the expected bonus after weighting every payout by its probability.
Here is the formula:
=SUMPRODUCT(D2:D6,E2:E6)
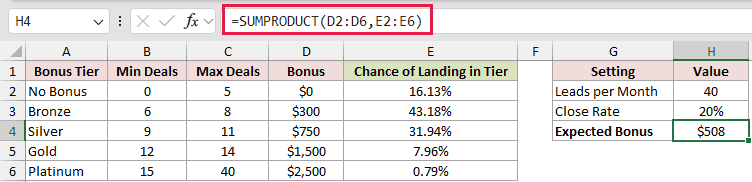
SUMPRODUCT multiplies each bonus by its tier probability and adds the results. The expected bonus is $508.
Pro Tip: These tiers cover every possible result from 0 through 40 deals, so their probabilities add to 100%.
Example 4: Calculate At-Least SLA Chances
Now let’s compare the chance that each carrier meets its weekly service target.
Below is the dataset. It lists six fictional carriers, shipment counts, on-time rates, SLA minimums, and a green result header with empty bordered cells below it.
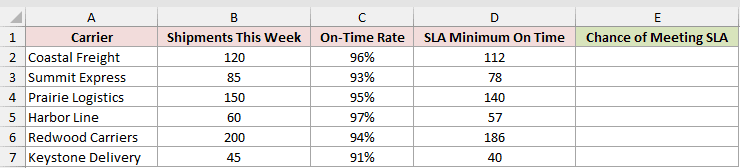
We want each carrier’s probability of meeting or exceeding its minimum on-time shipment count.
Here is the formula:
=BINOM.DIST.RANGE(B2:B7,C2:C7,D2:D7,B2:B7)
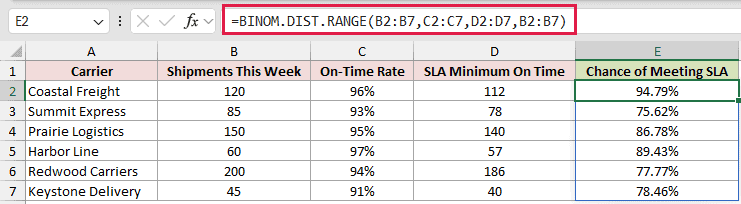
The SLA minimum supplies the lower limit. The shipment count supplies both the number of trials and the largest possible success count.
Coastal Freight has a 94.79% chance of meeting its SLA. Summit Express has the lowest displayed chance at 75.62%.
Example 5: Find Applications Needed for a Goal
Let’s find how many applications give a 90% chance of at least three interviews when the interview rate is 8%.
Below is the dataset. It lists application counts from 20 through 70, a green probability header with empty bordered cells, three settings, and an empty required-count cell.
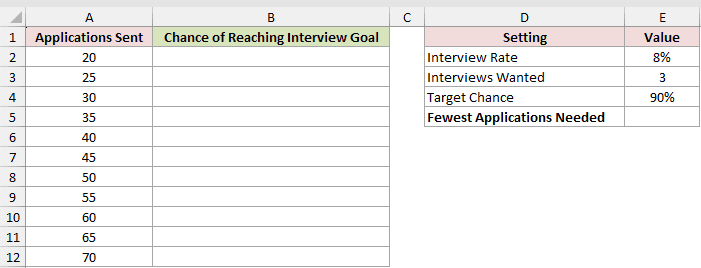
First, we want the chance of getting at least three interviews for each application count.
Here is the formula:
=BINOM.DIST.RANGE(A2:A12,$E$2,$E$3,A2:A12)
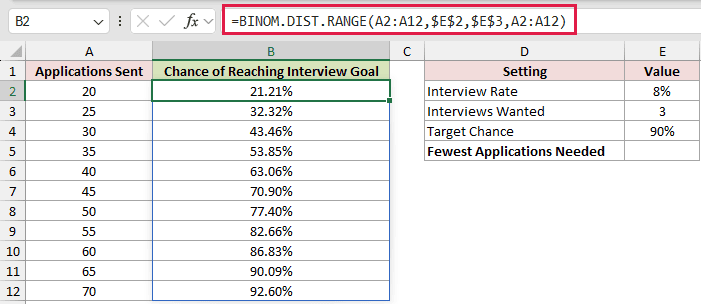
The probabilities rise with the application count. Sending 60 applications reaches 86.83%, while 65 applications reaches 90.09%.
Next, we want the first application count whose probability meets the 90% target.
Here is the formula:
=XLOOKUP(TRUE,B2:B12>=E4,A2:A12)
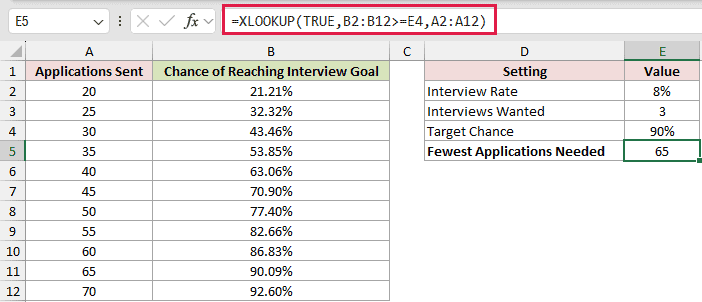
The comparison marks every qualifying row TRUE. XLOOKUP returns the application count for the first TRUE, which is 65.
XLOOKUP works in Excel 2021, Excel 2024, and Microsoft 365. In Excel 2019, =MINIFS(A2:A12,B2:B12,">="&E4) can return the qualifying count.
Example 6: Test Errors and Decimal Limits
The last example shows how Excel handles several boundary cases.
Below is the dataset. It lists trials, success rates, lower and upper limits for seven scenarios, with a green Result header and empty bordered cells below it.
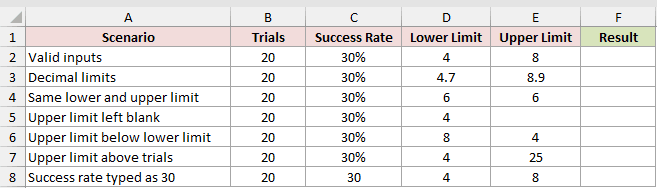
We want to see which rows return probabilities and which return errors.
Here is the formula:
=BINOM.DIST.RANGE(B2:B8,C2:C8,D2:D8,E2:E8)
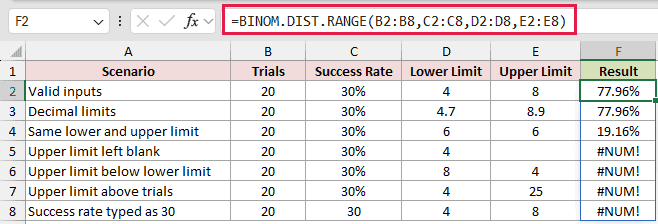
The valid row returns 77.96%. Decimal limits 4.7 and 8.9 are truncated to 4 and 8, so that row also returns 77.96%.
Using 6 for both limits calculates exactly 6 successes and returns 19.16%.
The remaining rows return #NUM!. The blank upper limit is read as 0, which is below the lower limit of 4.
Other causes are an upper limit below the lower limit, an upper limit above the 20 trials, and a success rate of 30 in the last row.
Pro Tip: Omitting number_s2 returns the probability of exactly number_s successes. Referencing a blank upper-limit cell is different because Excel reads that cell as 0 and may return #NUM!.
Tips & Common Mistakes
- Keep the argument order straight. BINOM.DIST.RANGE starts with
trials, while BINOM.DIST starts with the success count and includes a cumulative argument. - Treat both limits as inclusive. For more than
k, start atk+1. For fewer thank, end atk-1. - Excel truncates decimal values in
trials,number_s, andnumber_s2to integers. - Keep both success limits from 0 through
trials, with the upper limit at least as large as the lower limit. - Enter probability as a value from 0 through 1. Typing 30 instead of 30% returns
#NUM!. - A blocked spill area returns
#SPILL!. Clear the cells below or beside the formula so the complete result can appear. - BINOM.DIST.RANGE is available in Excel 2013 and later. Range-based spills require Excel 2021, Excel 2024, or Microsoft 365.
- In Excel 2021, Excel 2024, and Microsoft 365, the probability argument can take a range or array to compare success rates in one spilled formula.
=BINOM.DIST.RANGE(10,{0.2;0.3;0.4},3,10)spills 0.322200, 0.617217, and 0.832710, displayed as 32.22%, 61.72%, and 83.27%. - Use the range form for large trial counts instead of adding many exact probabilities by hand.
BINOM.DIST.RANGE returns one probability for an exact success count or an inclusive band of counts.
Set the lower and upper success limits to match the probability question you need to answer.
Related Excel Functions / Articles:
