
Excel’s PROB function returns the probability that a discrete outcome falls between specified lower and upper limits.
It uses one range of possible values and a matching range of probabilities. Leave out upper_limit when you want the probability of one exact value.
In this article, I’ll show you how to calculate exact and range probabilities, build cumulative results, and catch an invalid probability distribution.
PROB Function Syntax in Excel
The PROB function uses matching outcome and probability ranges, followed by one or two limits.
=PROB(x_range, prob_range, lower_limit, [upper_limit])
- x_range (required) contains the numeric outcomes.
- prob_range (required) contains each outcome’s probability. It must have the same number of entries as x_range, and its values must total 1.
- lower_limit (required) is the smallest outcome to include. Microsoft’s page lists it as optional, but Excel won’t accept PROB without it.
- upper_limit (optional) is the largest outcome to include. If you leave it out, PROB returns the probability of the lower_limit value alone.
Both limits are inclusive when you supply an upper_limit.
When to Use PROB Function
- Find the probability of one exact outcome in a discrete distribution.
- Add the probabilities for outcomes within a specified range.
- Calculate open-ended results such as at least or at most a given value.
- Build a cumulative probability table from one formula.
- Validate that a probability distribution totals 100% before using it.
Example 1: Find an Exact Outcome Probability
Let’s start with one prize on a wheel.
Below is the dataset. Columns A and B list six prize amounts and their probabilities, with an empty answer cell beside Chance of Winning $50.
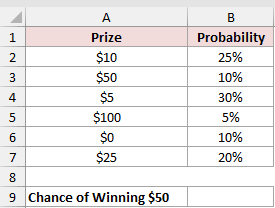
The answer cell should return the chance that the wheel lands on the $50 prize.
Here is the formula:
=PROB(A2:A7,B2:B7,50)
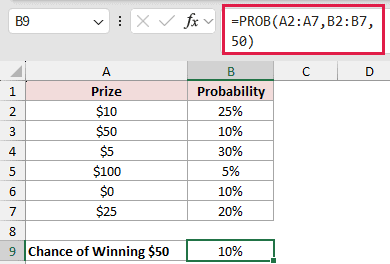
The formula returns 10%. Because upper_limit is omitted, PROB includes only the outcome equal to 50.
The prizes are listed in wheel order rather than numerical order. PROB still works because x_range doesn’t need to be sorted.
Example 2: Calculate Probabilities for Demand Bands
Here’s a practical way to group daily sales into demand bands.
Below is the dataset. Columns A and B hold desks sold and probabilities. The card in D:G lists three demand bands with empty probability cells.
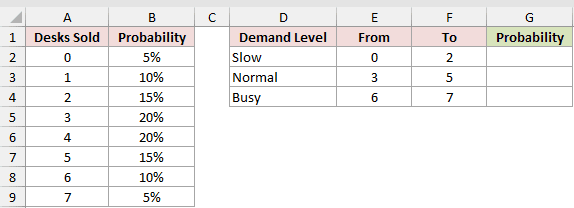
Column G should return the probability for each range shown in the From and To columns.
Here is the formula entered in G2 and copied down:
=PROB($A$2:$A$9,$B$2:$B$9,E2,F2)
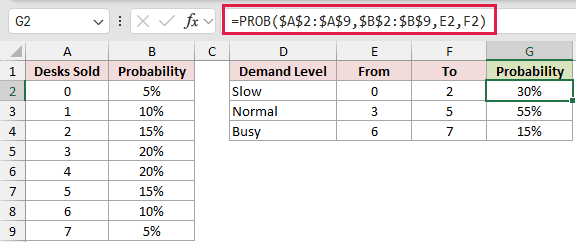
The Slow, Normal, and Busy bands return 30%, 55%, and 15%. Together, they cover every possible outcome and total 100%.
PROB includes both limits. The first row therefore adds the probabilities for 0, 1, and 2 desks sold.
The dollar signs keep the source ranges fixed as the formula moves down, while E2 and F2 change for each band.
Example 3: Calculate At Least and At Most
Let’s use party sizes to handle open-ended limits.
Below is the dataset. Columns A and B contain party sizes and probabilities. Three labeled answer cells are empty below the table.
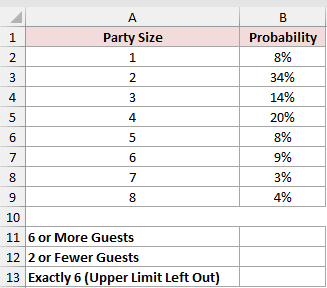
The answer cards should compare at least six guests, at most two guests, and exactly six guests.
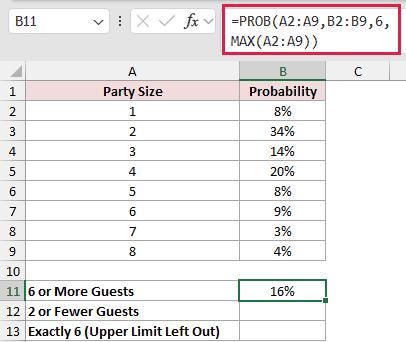
Here is the formula for six or more guests:
=PROB(A2:A9,B2:B9,6,MAX(A2:A9))
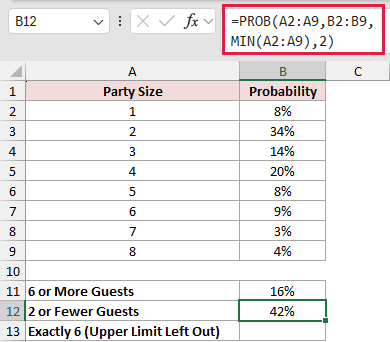
Here is the formula for two or fewer guests:
=PROB(A2:A9,B2:B9,MIN(A2:A9),2)
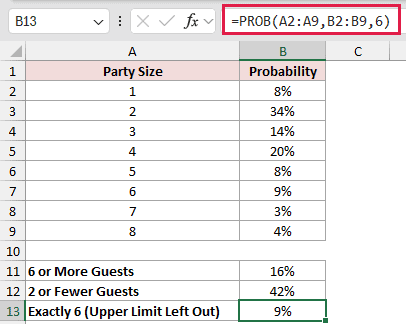
Now compare those results with a formula that leaves out upper_limit:
=PROB(A2:A9,B2:B9,6)
The first two formulas return 16% and 42%. MAX extends the first interval upward, while MIN extends the second interval downward.
The final formula returns 9%, which is the probability of exactly six guests. Omitting upper_limit doesn’t mean six or more.
SUMIFS can calculate the first result with =SUMIFS(B2:B9,A2:A9,">=6"). That’s shorter, but it doesn’t check whether the probabilities total 100%.
Pro Tip: Use MAX(A2:A9) as the upper limit for “at least” calculations and MIN(A2:A9) as the lower limit for “at most” calculations.
Example 4: Build an At Least Probability Table
Now let’s calculate a cumulative probability for every possible stay length.
Below is the dataset. Columns A and B list nights booked and probabilities. Column C has empty bordered cells for the at least results under a green header.
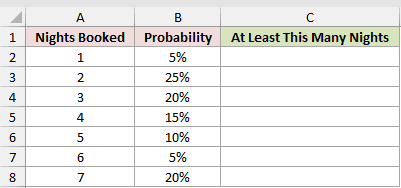
Column C should return the probability of booking at least the number of nights shown on each row.
Here is the formula entered in C2:
=PROB(A2:A8,B2:B8,A2:A8,MAX(A2:A8))
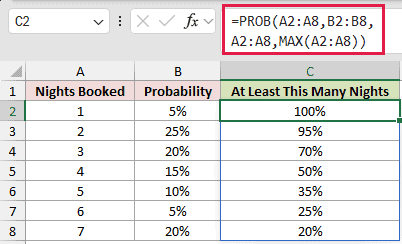
The lower_limit argument receives every value in A2:A8. PROB returns one result for each value, so the answers spill down column C.
At least one night returns 100%, at least two returns 95%, and at least seven returns 20%.
This spill requires Excel 2021, Excel 2024, or Microsoft 365. Older versions don’t spill the results.
Pro Tip: Keep C2:C8 empty before entering the formula. Any content in that output area can cause a #SPILL! error.
Example 5: Convert Counts Into Probabilities
Here’s how to start with observed order counts instead of ready-made probabilities.
Below is the dataset. A:B lists delivery days and order counts. Column C has the green Probability header with empty cells below.
The E:F card has Delivery Promise and Chance headers. Within 3 Days appears in E2, with an empty answer cell in F2.
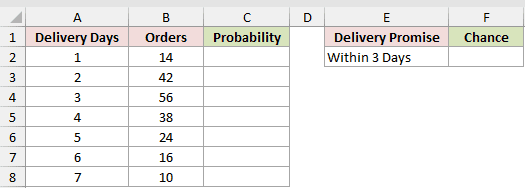
First, column C should convert each order count into a share of all 200 orders.
Here is the formula entered in C2:
=B2:B8/SUM(B2:B8)
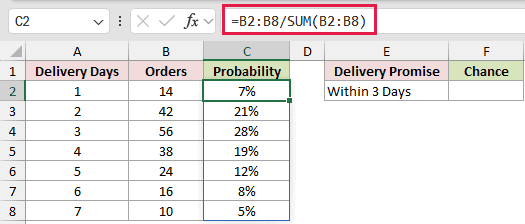
The formula divides every count by the total and spills the results down column C. The first three probabilities are 7%, 21%, and 28%.
We can now calculate the chance that an order arrives within three days.
Here is the PROB formula:
=PROB(A2:A8,C2:C8,1,3)
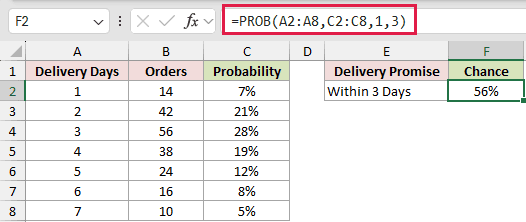
PROB adds the probabilities for delivery days 1 through 3 and returns 56%.
The first formula makes the probability distribution easy to inspect before the second formula uses it.
Pro Tip: If you don’t need the helper column, =PROB(A2:A8,B2:B8/SUM(B2:B8),1,3) calculates the same 56% directly from the counts.
Example 6: Diagnose a PROB NUM Error
Let’s check ticket-quantity estimates that may not add up to 100%.
Below is the dataset. Columns A and B list ticket quantities and estimated probabilities. Two labeled cells below the table are empty for the check and result.
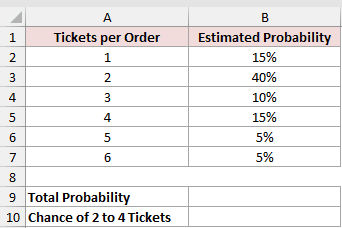
The first answer cell should confirm whether the estimated probabilities form a complete distribution.
Here is the check formula:
=SUM(B2:B7)
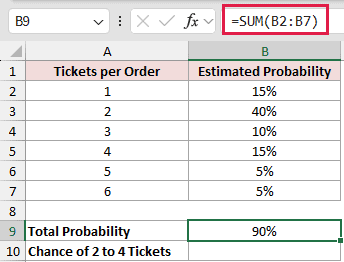
Next, calculate the chance of an order containing two to four tickets.
Here is the PROB formula:
=PROB(A2:A7,B2:B7,2,4)
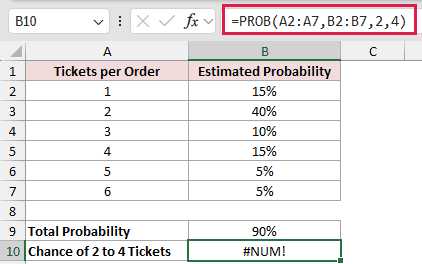
The SUM formula returns 90%, so the probabilities are missing 10%. PROB returns #NUM! instead of calculating from an incomplete distribution.
Check whether an outcome was omitted before changing the probabilities. If you’ve confirmed no outcome is missing, divide each estimate by the total to rescale the set to 100%.
Tips & Common Mistakes
- The probability range must total 1, or 100%. Small floating-point drift is tolerated, but an incomplete total such as 90% returns #NUM!.
- A probability of exactly 0 is accepted. You can keep an impossible outcome in the distribution when that row is useful.
- x_range and prob_range must contain the same number of entries. Mismatched sizes return #N/A.
- A lower limit greater than the upper limit returns 0. Limits outside all listed outcomes can also return 0, so check the limit cells carefully.
- Limits don’t need to match listed outcomes. A range from 1.5 to 3 includes only x values that fall inside that interval.
- SUMIFS and SUMPRODUCT can add selected probabilities, but they don’t validate whether the probability range totals 100%.
- PROB is for discrete outcomes. Use NORM.DIST for continuous normal data, POISSON.DIST for event counts, or BINOM.DIST for success and failure counts.
PROB works with one exact value or an inclusive range in a discrete probability table.
Leave out upper_limit for one exact outcome. Supply it when you want the values between two limits.
Related Excel Functions / Articles:
