
Excel’s BINOM.INV function returns the smallest number of successes whose cumulative binomial probability reaches a specified threshold.
The result is a count, not a probability. It answers questions such as how many defects, claims, or arrivals cover a chosen confidence level.
In this article, I’ll show you how to verify that count, build service-level tables, plan capacity, and catch invalid inputs.
BINOM.INV Function Syntax in Excel
The BINOM.INV function uses a trial count, a success probability, and a cumulative probability threshold.
=BINOM.INV(trials,probability_s,alpha)
- trials (required) is the number of independent trials. Excel truncates a decimal value to an integer.
- probability_s (required) is the probability of success on each trial. It must be greater than 0 and less than 1.
- alpha (required) is the cumulative probability threshold. It must be greater than 0 and less than 1.
When to Use BINOM.INV Function
- Set a defect-count limit for quality inspections.
- Estimate how many warranty claims or spare parts a service level should cover.
- Plan bookings when each customer has the same chance of arriving.
- Create lower and upper count limits for routine monitoring.
- Convert a cumulative probability target into a count of successes.
Example 1: Understand the BINOM.INV Result
Let’s start by checking why Excel returns a particular count.
Below is the dataset. It shows three audit settings, three result labels, and empty bordered cells where the answers will appear.
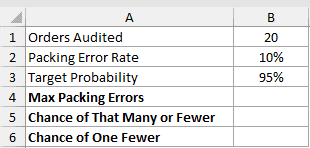
This calculation finds the smallest packing-error count whose cumulative probability reaches 95%.
Here is the formula:
=BINOM.INV(B1,B2,B3)
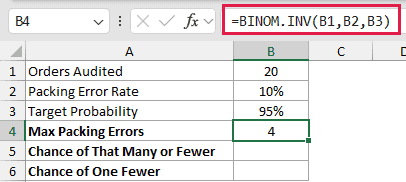
The formula returns 4. This means four is the smallest count that reaches the target, not that exactly four errors have a 95% chance.
We can check the cumulative probability at four errors with BINOM.DIST.
=BINOM.DIST(B4,B1,B2,TRUE)
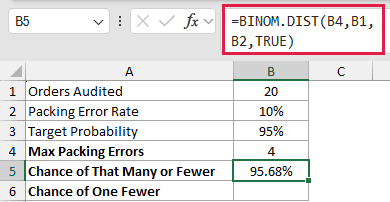
The cumulative probability at four errors is 95.68%, which clears the 95% target.
Now check the cumulative probability at one fewer error.
=BINOM.DIST(B4-1,B1,B2,TRUE)
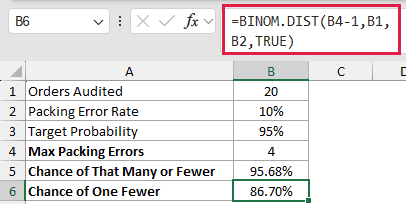
At three errors, the cumulative probability is only 86.70%. That is why BINOM.INV returns 4 rather than 3.
Pro Tip: CRITBINOM is the older compatibility name for this calculation. BINOM.INV is its replacement and uses the same three inputs.
Example 2: Set Quality Inspection Limits
Here’s a quality-control example with several product lines.
Below is the dataset. It lists each product line, sample size, and defect rate. Two green headers and empty columns reserve the 95% and 99% limits.
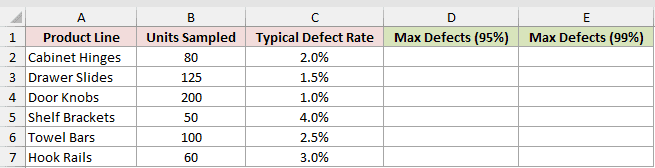
For each product line, we’ll calculate a 95% defect-count limit.
Here is the formula entered in D2, which spills through D7:
=BINOM.INV(B2:B7,C2:C7,0.95)
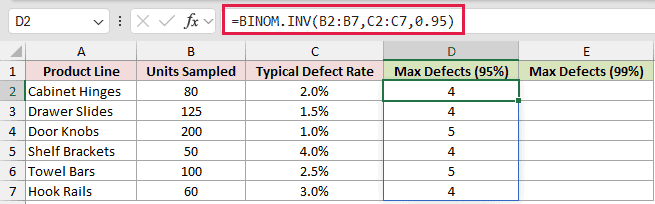
Cabinet Hinges returns 4, while Door Knobs returns 5. Each row uses its own sample size and typical defect rate.
We can apply a stricter 99% threshold in the next column.
=BINOM.INV(B2:B7,C2:C7,0.99)
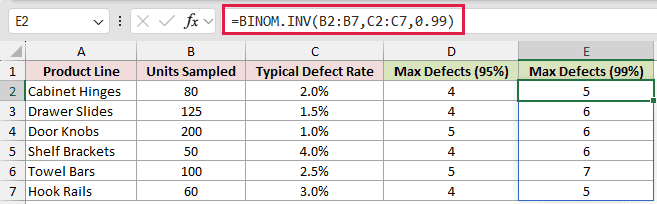
Every product line’s limit rises at 99%. Cabinet Hinges rises from 4 to 5, while Drawer Slides rises from 4 to 6.
These formulas spill in Excel 2021, Excel 2024, and Microsoft 365. In Excel 2019 and earlier, enter a single-row formula and fill it down.
Example 3: Build a Spare-Stock Service Table
Now let’s turn several service targets into stocking levels.
Below is the dataset. Column A lists target probabilities, and the side card holds warranty settings. The green header and empty cells mark the stocking results.
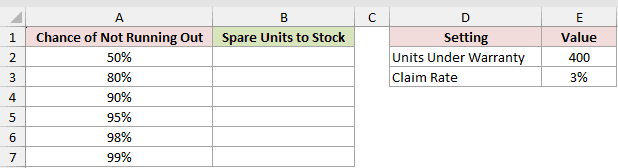
The goal is to find the spare units needed at each target probability.
Here is the spilling formula entered in B2:
=BINOM.INV($E$2,$E$3,A2:A7)
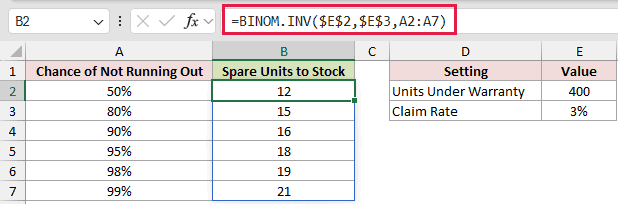
The absolute references keep 400 warranty units and the 3% claim rate fixed. Each value in column A supplies a different alpha.
A 50% target returns 12 spare units. The requirement rises to 18 at 95% and 21 at 99%.
A higher chance of avoiding a stockout requires more spare units.
Example 4: Find a Safe Booking Limit
Here’s a capacity-planning example for a 120-room property.
Below is the dataset. It lists booking counts and empty bordered cells under the green “Max Guests Showing Up” header, plus three settings and an empty bordered cell for the final booking answer.
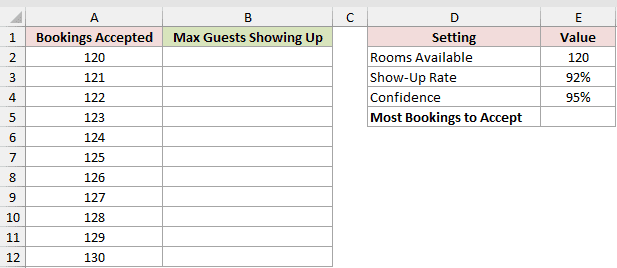
First, we’ll calculate the 95% arrival limit for each booking count.
Here is the formula entered in B2, which spills through B12:
=BINOM.INV(A2:A12,$E$3,$E$4)
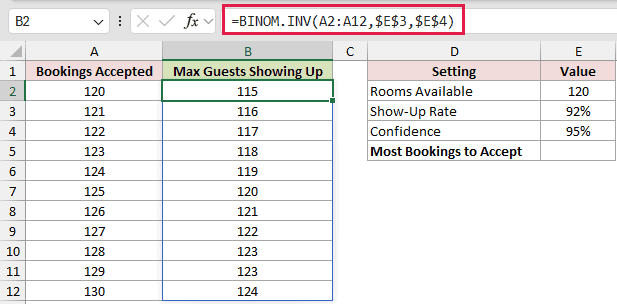
For 120 bookings, the 95% arrival limit is 115 maximum guests showing up. At 130 bookings, the limit rises to 124.
Next, MAXIFS finds the largest booking count whose arrival limit does not exceed the 120 available rooms.
MAXIFS requires Excel 2019 or later, or Microsoft 365.
=MAXIFS(A2:A12,B2:B12,"<="&E2)
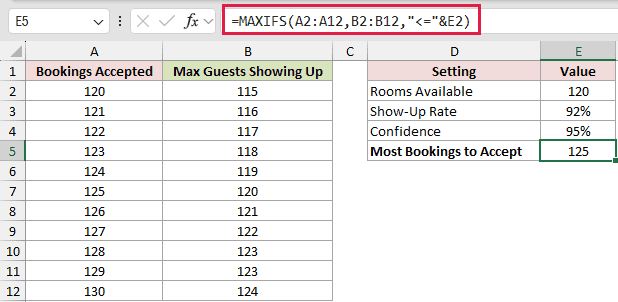
The formula returns 125. At that booking level, the 95% arrival limit is 120, so it still fits the available capacity.
At 126 bookings, the arrival limit becomes 121. That is the first option in this table that exceeds capacity.
Example 5: Flag Counts Outside a Normal Range
Let’s use two BINOM.INV results to monitor weekly survey responses.
Below is the dataset. It shows weeks and Yes counts, empty bordered cells under the green Status header, survey settings, and two empty bordered cells for the range limits.
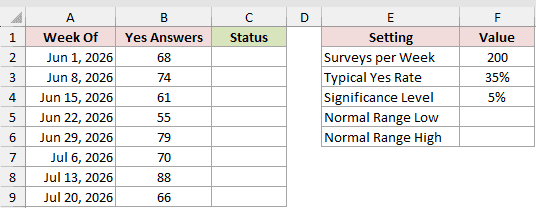
Here, we’ll find the lowest count that remains inside the central range.
Here is the lower-limit formula:
=BINOM.INV(F2,F3,F4/2)
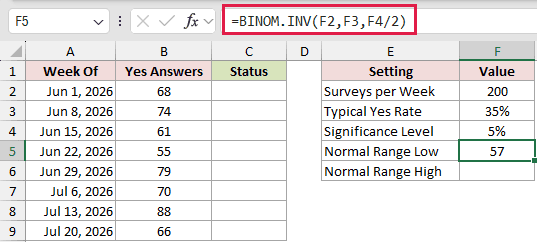
BINOM.INV returns 57 because it is the first count whose cumulative probability reaches 2.5%.
The chance of 56 or fewer is 2.13%, while 57 or fewer reaches 3.05%. Therefore, 56 or fewer forms the lower tail.
Now calculate the upper limit using the remaining 97.5% cumulative probability.
=BINOM.INV(F2,F3,1-F4/2)
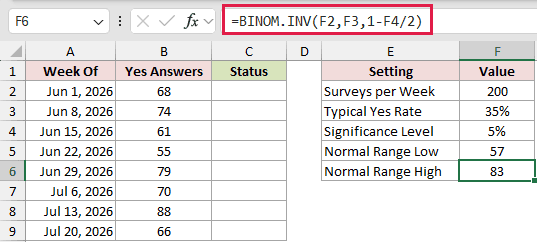
The upper formula returns 83. Together, the two results define a normal range of 57 through 83 Yes answers.
Finally, compare every weekly result with those two limits.
=IF((B2:B9<F5)+(B2:B9>F6),"Unusual","Normal")
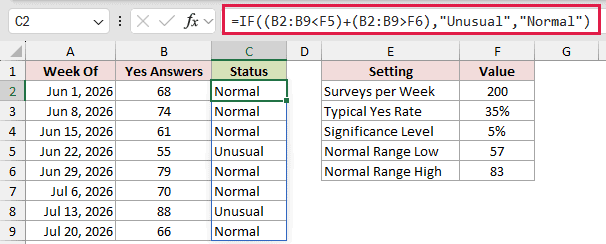
The spilled IF formula flags 55 and 88 as Unusual. The remaining weekly counts fall inside the 57 through 83 range.
Whole-number outcomes make the cumulative distribution move in steps, so this band covers 95.50%.
Pro Tip: BINOM.DIST.RANGE can check the probability covered by the finished band. Here, the range from 57 through 83 covers 95.50%.
Example 6: Check Errors and Edge Inputs
The final example puts several common input mistakes side by side.
Below is the dataset. It lists seven input scenarios for trials, success rate, and alpha. The green result header and empty cells reserve the returned values or errors.
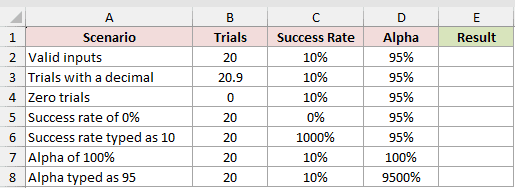
This comparison shows how BINOM.INV handles each valid or invalid set of inputs.
Here is the formula entered in E2, which spills through E8:
=BINOM.INV(B2:B8,C2:C8,D2:D8)
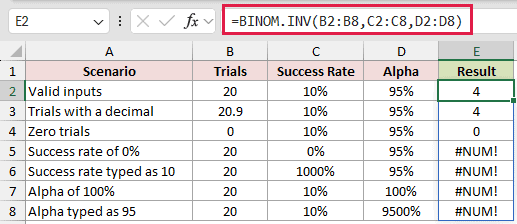
The valid row returns 4. A trial count of 20.9 also returns 4 because Excel truncates trials, while zero trials returns 0.
A success rate of 0% returns #NUM!. Entering 10 where 10% was meant displays 1000% and also returns #NUM!.
An alpha of 100% also returns #NUM!. Entering 95 where 95% was meant displays 9500% and returns the same error.
Tips & Common Mistakes
- Read the result as an “at most” count at the selected cumulative threshold.
- Keep both probability_s and alpha strictly between 0 and 1. The boundary values 0 and 1 return #NUM!.
- Enter percentages as 10% or 0.10. A whole number always returns #NUM! for probability_s or alpha.
- Keep the cells below and beside a spilling formula empty. Occupied cells cause a #SPILL! error.
- In Excel 2019 and earlier, range formulas do not spill. Use a single-row BINOM.INV formula and fill it down.
BINOM.INV turns a cumulative probability target into a count for planning, monitoring, or setting practical limits.
Use that count to set defect limits, stock levels, or booking capacity.
Other Excel articles you may also like:
