
Excel’s FACT function returns the factorial of a nonnegative number. It multiplies each positive integer from that number down to 1, so FACT of 5 returns 120.
Factorials count complete arrangements of distinct items. Repeated identical items need duplicate correction, while selecting fewer items requires a factorial ratio or a dedicated permutation function.
In this article, I’ll show you how FACT counts complete arrangements, corrects for identical items, supports exact-order probabilities, and relates to PERMUT.
FACT Function Syntax in Excel
The FACT function uses the following syntax:
=FACT(number)
numberis the required nonnegative number for which you want the factorial.
If number is not an integer, Excel truncates its decimal portion before calculating the factorial.
When to Use FACT Function
- Count complete arrangements of distinct items.
- Build factorial tables for several input values.
- Correct arrangement counts when some items are identical.
- Calculate the probability of one exact order under uniform random selection.
- Derive ordered partial selections with a factorial ratio.
Example 1: Count Complete Display Sequences
Let’s begin with distinct display components.
Below is the dataset with component counts from 3 through 8 and an empty column for complete display sequences.
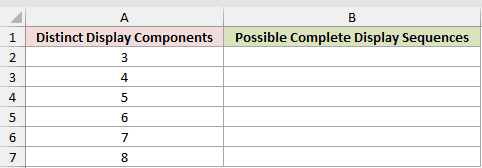
We want to count every possible sequence when all distinct display components are used exactly once.
Enter this formula in cell B2:
=FACT(A2:A7)
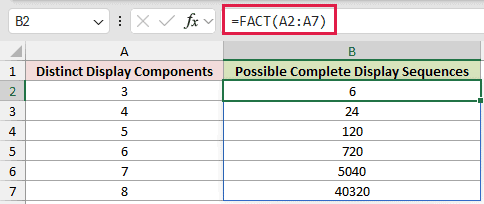
In Excel 2021, Excel 2024, and Microsoft 365, this array formula spills results through B7.
Three components have 6 possible sequences. Five components have 120, while eight components have 40,320.
For five components, the count is 5 times 4 times 3 times 2 times 1. Each position uses one remaining component.
The counts rise quickly because adding one component multiplies the previous factorial by the new number.
Pro Tip: This direct factorial count assumes every component is distinct. If two components are interchangeable, swapping them does not create a new visible sequence.
Example 2: Arrange Identical Sample Packs
Now let’s account for repeated colors.
Below is the dataset with three red, three blue, and two white sample packs.
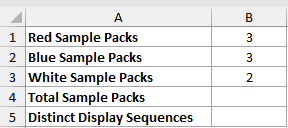
We first want to calculate the total number of sample packs.
Enter this formula in cell B4:
=SUM(B1:B3)
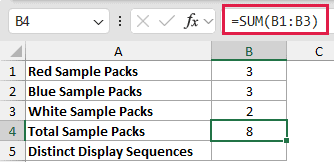
The SUM function returns 8 total packs.
We now want to count the distinct color sequences while treating packs of the same color as identical.
Enter this formula in cell B5:
=FACT(B4)/(FACT(B1)*FACT(B2)*FACT(B3))
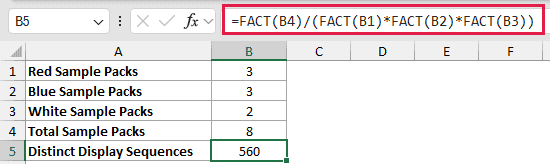
The numerator starts with all 8! arrangements. That count treats every pack as distinct, even when two swaps produce the same color sequence.
The denominator divides out the duplicate arrangements within the three red, three blue, and two white packs. The result is 560 distinct color sequences.
Numerically, 8! is 40,320 and 3! times 3! times 2! is 72. Dividing 40,320 by 72 gives 560.
Pro Tip: The division applies only because packs are identical within each color. If every pack has its own label, all eight items are distinct and the count is 40,320.
Example 3: Probability of One Exact Order
This example uses a factorial count as a probability denominator.
Below is the dataset with five distinct delivery markers and empty result cells for the order count and exact-order probability.
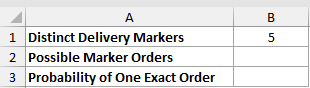
We first want to count all possible orders of the five distinct markers.
Enter this formula in cell B2:
=FACT(B1)
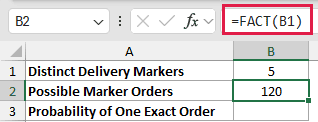
FACT returns 120 possible marker orders.
We next want the probability of drawing one specified order from those 120 possibilities.
Enter this formula in cell B3:
=1/B2
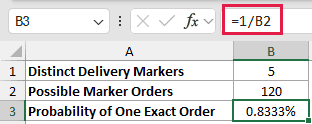
The result is 1/120, displayed as 0.8333%.
This probability is valid only when the selection process makes all 120 orders equally likely. A biased process needs probabilities based on its actual selection rules.
Pro Tip: A count alone does not prove equal probability. Confirm that every complete order has the same chance before using 1 divided by the factorial.
Example 4: Choose Part of a Set in Order
Let’s finish with a partial ordered selection.
Below is the dataset with eight available product photos and three positions in a lead sequence.
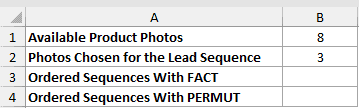
We first want to count the ordered three-photo sequences using a factorial ratio.
Enter this formula in cell B3:
=FACT(B1)/FACT(B1-B2)
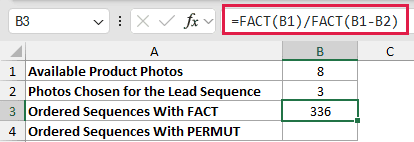
The formula divides 8! by 5!, canceling the unused part of the factorial. The remaining calculation is 8 times 7 times 6, or 336.
We also want to check the same ordered count with Excel’s direct permutation function.
Enter this formula in cell B4:
=PERMUT(B1,B2)
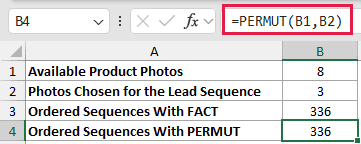
PERMUT also returns 336. It directly counts ordered selections without replacement when fewer than all available items are chosen.
The FACT ratio explains the mathematics, while PERMUT is shorter for this task. If photo order does not matter, use the COMBIN function.
Tips & Common Mistakes
FACT(0)returns 1. There is one way to arrange an empty set.- Excel truncates noninteger inputs. For example,
FACT(5.9)is calculated asFACT(5)and returns 120. - A negative number returns
#NUM!because FACT accepts only nonnegative inputs. - Use FACT directly when arranging every distinct item. Use a factorial ratio or PERMUT when selecting fewer items in order.
- Divide by each repeated group’s factorial when identical items would otherwise create duplicate arrangements.
- Use COMBIN instead of FACT or PERMUT when changing the order does not create a new result.
- Spilled factorial formulas need empty destination cells. A blocked range returns a
#SPILL!error. - In Excel 2019 and earlier, use a row-level FACT formula and fill it down instead of relying on a dynamic spill.
FACT calculates factorials for complete arrangements and related counting formulas. The examples covered distinct items, identical groups, exact-order probability, and partial ordered selections.
I hope you found this article helpful.
Related Excel Functions / Articles:
