
The MULTINOMIAL function in Excel counts distinct arrangements of items when some items are identical, or assignments of people into labelled groups of fixed sizes.
Swapping identical letters leaves the arrangement unchanged. When assigning volunteers, we count who goes to each named station.
In this article, I’ll show you how to count these arrangements and calculate the probability of a particular customer split.
MULTINOMIAL Function Syntax in Excel
Pass the group sizes as separate arguments or as a range:
=MULTINOMIAL(number1, [number2], ...)
- number1 (required): The first group size, or a range containing the group sizes.
- number2, … (optional): Additional group sizes or ranges to include in the same calculation.
MULTINOMIAL divides the factorial of the total by the product of the individual group factorials.
A factorial multiplies a whole number by every positive whole number below it.
Use nonnegative whole numbers for group sizes. Excel truncates decimals, and the combined total cannot exceed 170.
When to Use MULTINOMIAL Function
- Count distinct arrangements of a word containing repeated letters.
- Assign volunteers to named stations with fixed staffing requirements.
- Count sequences containing specified numbers of heads and tails.
- Calculate a multinomial probability using category counts and probabilities.
- Count possible orders of a schedule containing repeated activities.
Example 1: Arrange Letters With Repeats
Let’s start with the letters in MISSISSIPPI.
Below is the dataset. Columns A and B list letters and counts; the labelled cells in column E will hold the total, arrangement count, and FACT check.
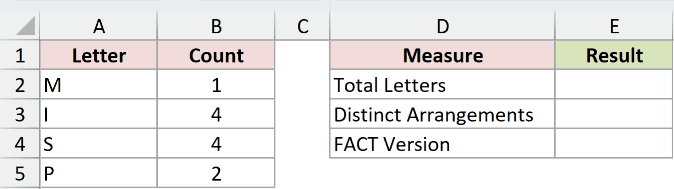
We want to count distinct letter arrangements without treating repeated copies of the same letter as different.
First, calculate the total letters in E2:
=SUM(B2:B5)
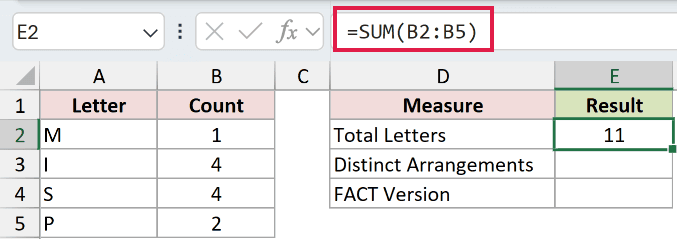
The total is 11. The counts describe M, I, S, and P, rather than individual positions in the word.
Enter the arrangement formula in E3:
=MULTINOMIAL(B2:B5)
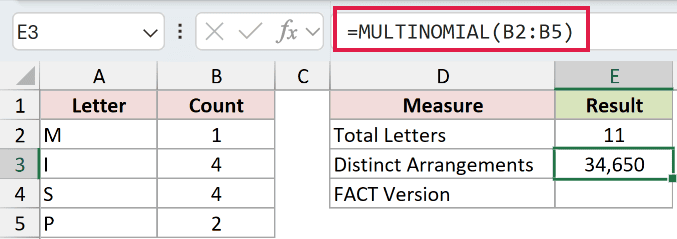
The result is 34,650 distinct arrangements. MULTINOMIAL takes all the counts in B2:B5 and returns a single answer. It doesn’t spill separate results for each letter.
To check the calculation using the longer FACT version, enter this in E4:
=FACT(SUM(B2:B5))/PRODUCT(FACT(B2:B5))
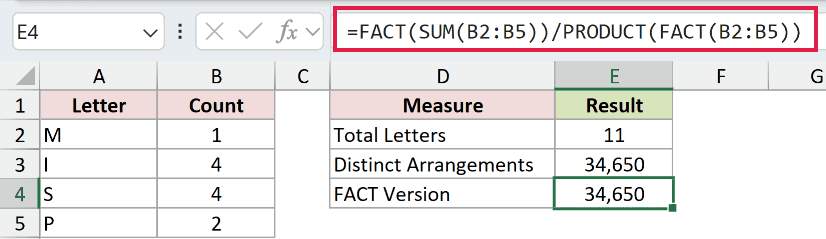
The FACT check also returns 34,650.
How this formula works:
- SUM adds the letter counts, and the outer FACT calculates the factorial of that total.
- FACT applied to B2:B5 calculates each repeated letter’s factorial.
- PRODUCT multiplies those factorials. Dividing by that product removes arrangements counted again because identical letters were swapped.
MULTINOMIAL packages that calculation into a shorter formula, so you don’t need to build the factorial division yourself.
Example 2: Assign Volunteers to Named Stations
Now let’s count assignments where the people are distinct and the stations have fixed capacities.
Below is the dataset. Column B lists volunteer totals, C:F hold station sizes, and G will show the assignment count for each event.
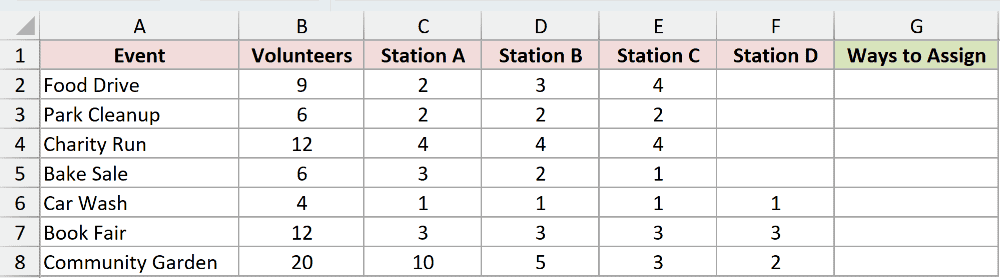
We want the number of ways to assign each event’s volunteers to its named stations.
Enter this in G2, then copy it down through G8:
=MULTINOMIAL(C2:F2)
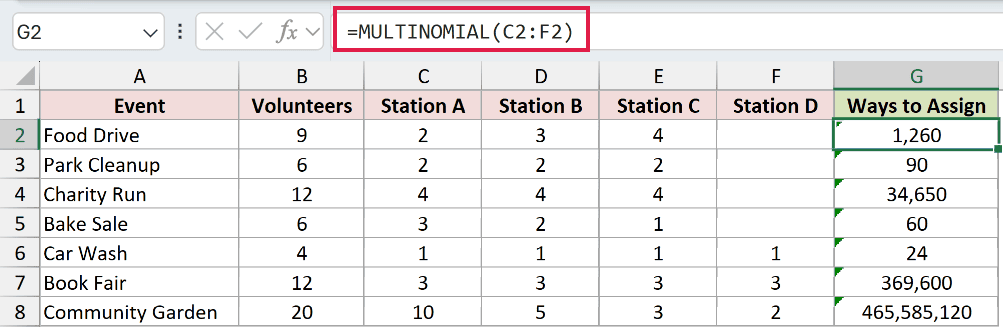
Food Drive returns 1,260 assignments. The blank Station D cell represents an unused station and doesn’t prevent the calculation.
Park Cleanup returns 90, Charity Run 34,650, and Bake Sale 60. Car Wash returns 24, while Book Fair returns 369,600.
Community Garden returns 465,585,120. The comma-separated number format makes this count easier to read than scientific notation.
Each copied formula combines only its own row’s station sizes. Giving MULTINOMIAL the whole station table would combine all those sizes into a single calculation.
Column B is a reference total, not an argument. Check that each row’s station sizes account for all its volunteers.
Pro Tip: Moving a volunteer between named stations changes the assignment, even with equal capacities. The order of volunteers within each station doesn’t matter.
Example 3: Compare MULTINOMIAL With COMBIN
COMBIN counts ways to choose a number of items from a total, ignoring order.
Here, it chooses which positions contain heads. Every remaining position must contain tails, so it counts the same complete sequences as MULTINOMIAL.
Below is the dataset. Columns A and B contain heads and tails counts; column C will hold MULTINOMIAL results, and D is the COMBIN comparison.
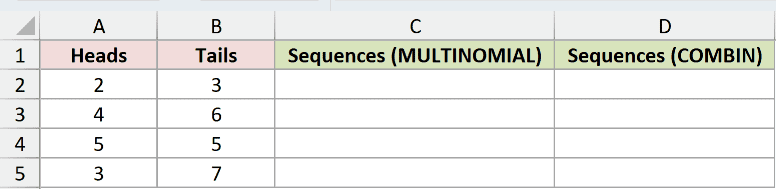
We want to count sequences containing exactly the heads and tails listed on each row.
Enter this in C2 and copy it down through C5:
=MULTINOMIAL(A2,B2)
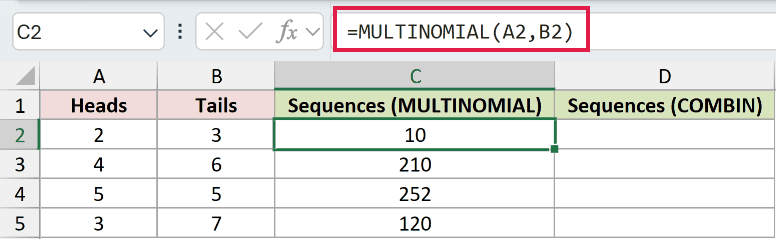
The first row returns 10 sequences. The remaining rows return 210, 252, and 120.
For the COMBIN comparison, enter this in D2 and copy it down through D5:
=COMBIN(A2+B2,A2)
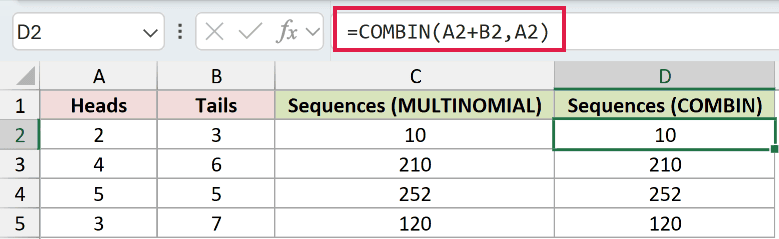
The COMBIN comparison returns the same counts: 10, 210, 252, and 120.
COMBIN is a direct choice for this two-group case. MULTINOMIAL is more convenient when you have additional categories.
Example 4: Calculate a Multinomial Probability
An arrangement count becomes a probability when you include how likely each category is.
Below is the dataset. Columns A:C list plans, assumed market shares, and customer counts; the result card will hold the survey total, orderings, and probability.

We want the probability of exactly this plan split, assuming independent customer choices and unchanged probabilities for each customer.
Calculate the customer total in F2:
=SUM(C2:C4)
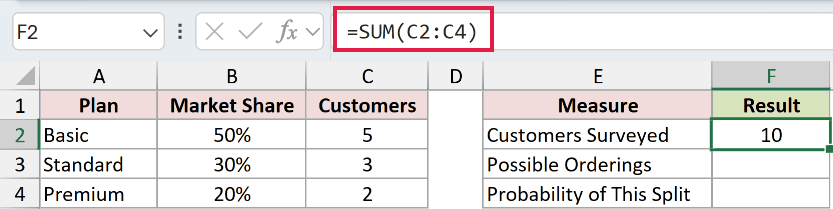
The total is 10 customers.
Next, count the possible orderings in F3:
=MULTINOMIAL(C2:C4)
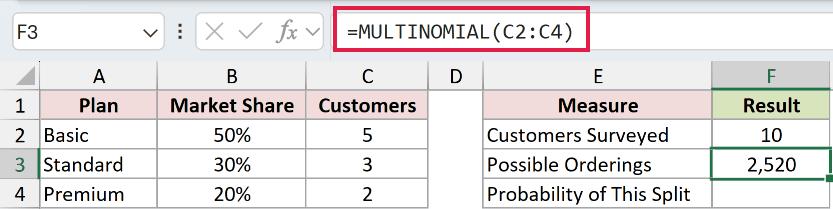
There are 2,520 orderings containing the specified Basic, Standard, and Premium counts.
Calculate the probability in F4:
=F3*PRODUCT(B2:B4^C2:C4)
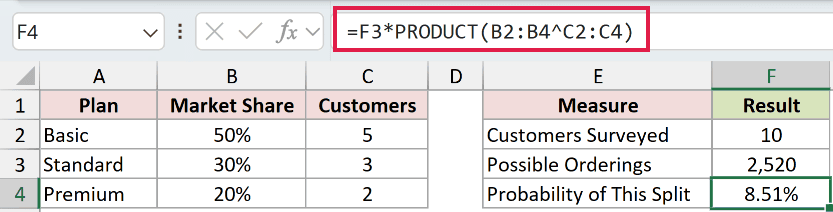
The result displays as 8.51%.
How this formula works:
B2:B4^C2:C4raises each plan’s assumed probability to its required customer count.- PRODUCT multiplies those terms to find the probability of a particular ordering.
- Multiplying by F3 includes all orderings with those same category counts.
This is the probability of the exact split shown, regardless of customer order. It isn’t the probability of meeting or exceeding those counts.
Example 5: Count Orders From a Session List
You can also calculate arrangements directly from repeated labels without building a separate count table.
Below is the dataset. Columns A and B list days and sessions; the labelled cells in E will show session types and possible plan orders.
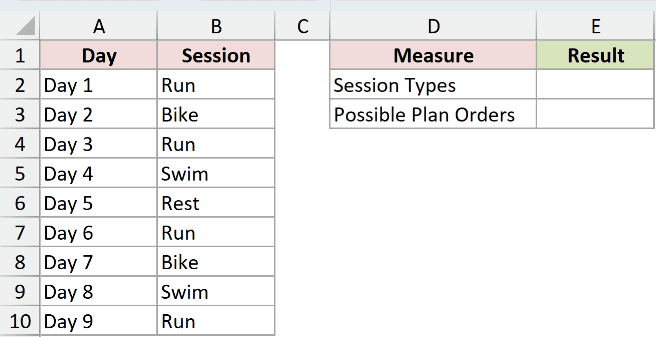
We want to rearrange the listed sessions while keeping the same number of each activity.
First, count the session types in E2:
=ROWS(UNIQUE(B2:B10))
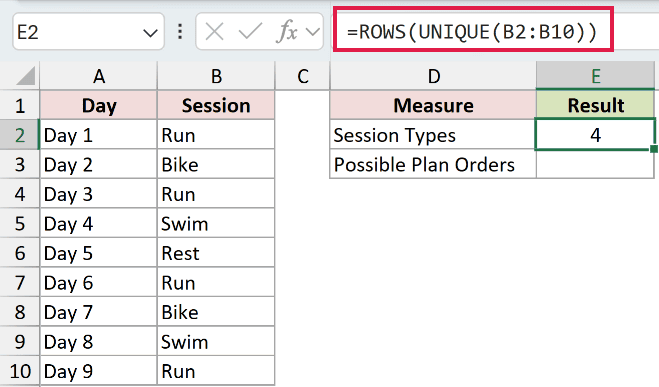
The result is 4: Run, Bike, Swim, and Rest. UNIQUE identifies the different labels, and ROWS counts them.
These UNIQUE-based formulas require Excel 2021, Excel 2024, or Microsoft 365. Their outer functions return single results, so neither formula spills onto the worksheet.
Now calculate the possible plan orders in E3:
=MULTINOMIAL(COUNTIF(B2:B10,UNIQUE(B2:B10)))
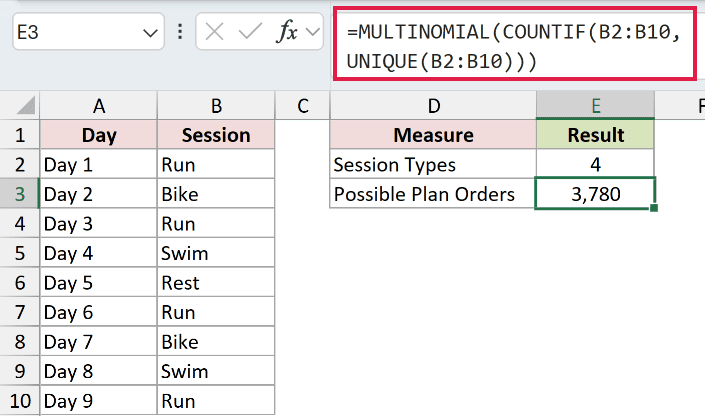
The result is 3,780 possible orders.
How this formula works:
- UNIQUE finds the different session labels in B2:B10.
- COUNTIF counts how often each label appears in that same range.
- MULTINOMIAL combines those counts into the number of distinct arrangements.
This counts every arrangement of the listed sessions. It doesn’t impose training rules, such as keeping rest days between runs.
Example 6: Check Invalid Inputs and Limits
Some questionable inputs return errors, while decimals quietly change the count.
Below is the dataset. Column A names each input case, B and C hold group sizes, and D will show the result or deliberate error.
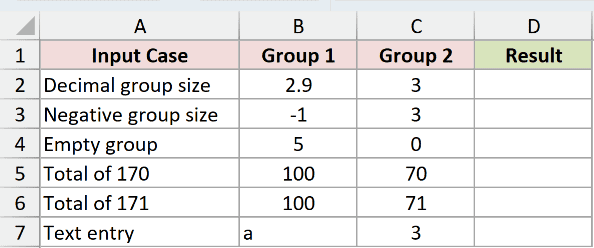
We want to see how MULTINOMIAL handles each input case separately.
Enter this in D2 and copy it down through D7:
=MULTINOMIAL(B2,C2)
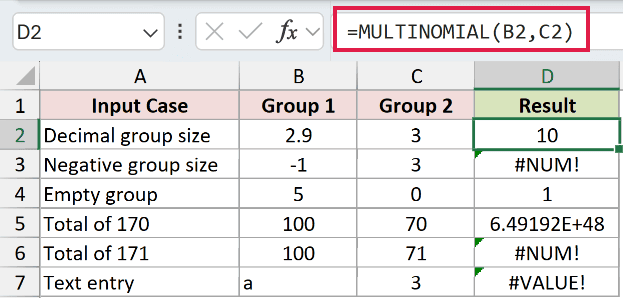
- Decimal group size: D2 returns 10. Excel truncates 2.9 to 2 before calculating, so an invalid fractional headcount can produce a plausible answer.
- Negative group size: D3 deliberately returns #NUM! because the first group size is -1. Correct the negative input.
- Empty group: D4 returns 1 for group sizes 5 and 0. A zero-sized group is allowed.
- Total of 170: D5 returns 6.49192E+48 for group sizes 100 and 70. The large result is displayed in scientific notation.
- Total of 171: D6 deliberately returns #NUM! for group sizes 100 and 71. The combined total exceeds the function’s limit.
- Text entry: D7 deliberately returns #VALUE! because
aisn’t a numeric group size. Replace it with a valid count.
The errors are part of this demonstration. Changing the number format won’t fix invalid inputs or the total-size limit.
Tips & Common Mistakes
- Keep groups labelled when counting assignments. For interchangeable equal-sized teams, MULTINOMIAL overcounts. Divide by the factorial of the number of interchangeable teams to remove duplicate team labels.
- Don’t expect row-by-row output from a whole table. MULTINOMIAL combines all supplied group sizes into one calculation. Copy a row formula down when each row is a separate problem.
- Validate counts before calculating. Decimal truncation can hide an input mistake, while a blank group cell behaves like a zero-sized group.
- Separate counts from probabilities. MULTINOMIAL alone counts arrangements. A probability calculation also needs category probabilities and the assumptions used in Example 4.
- Check the total, not only individual sizes. The combined group size cannot exceed 170, even when each individual group is smaller.
Related Excel Functions / Articles:
