The slope is commonly used in statistics, where it tells us how two variables are related in a dataset.
While I remember using a pen and a paper and some complex formulas to calculate the slope of a dataset, you can do it a lot faster in Excel.
In fact, there is an in-built function that allows you to easily calculate slope in Excel (as we will see).
What is Slope in Statistics?
In statistics, you can often get a task to calculate a slope of a line based on values generated by two coordinates (x and y).
In the other words, a slope can tell you how much y value changes as value x increases.

This way you can get a better insight into a dependency between two coordinates.
To give you a practical example, suppose we have the data from 100 households about the monthly income and expenses.
Assuming that the slope value of this dataset is 0.9, it tells us that when the income increases by 100 dollars, the expense increases by 90 dollars.
Excel SLOPE function
To get a slope value in Excel, you can use the SLOPE function.
The parameters of the function are:
=SLOPE(known_ys,known_xs)
- known_ys – an array or range of cells containing dependent numeric values (y)
- known_xs – an array or range of cells with independent values in numeric format (x)
Calculating Slope in Excel
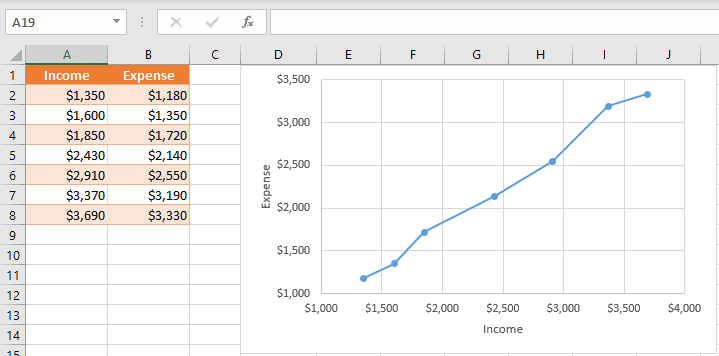
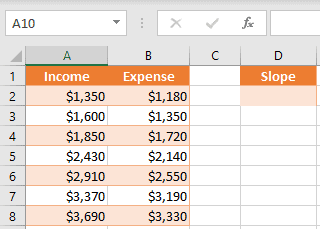
Suppose you have a dataset as shown below where we have the income and expense data, and you want to calculate the slope for this data.

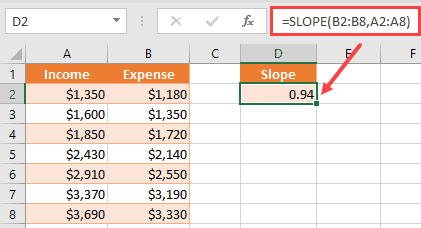
Below is the formula to calculate slope for this dataset (enter the formula in cell D2)
=SLOPE(B2:B8,A2:A8)
In this case, values for the Y coordinate are in column B, while values for the X coordinate are in column A.
As a result of the function, the value in cell D2 is 0.94.

This means that if the value for income (column A) increases by 1, the value of expense (column B), will increase 0.94 times.
This is a positive correlation, where both the data points move in the same direction (when income goes up the expense goes up and when income goes down then the expense goes down)
Also read: Calculate Class Width in Excel
Slope Can Be Negative As Well
You can also encounter a negative slope. This happens when there is a negative correlation, which means that if one values goes up, then the other value goes down (and vice versa)
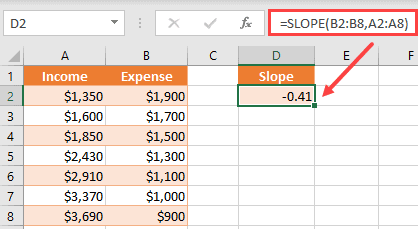
Let’s say that you have the following example with expenses decreasing as the income increases.

As you can see in the example above, while incomes are increasing, expenses are decreasing.
When the value of the income increases by 1, the expense will decrease 0.41 times (or if the income decreases by 1, then the expense will increase by 0.41).
Therefore, the slope for this correlation is negative.
Also read: How to Calculate Year-Over-Year (YOY) Growth in Excel (Formula)
Some Error When Using the SLOPE function
Now you will see some of the most common errors that occur during the Slope function usage in Excel.
- The first parameter of the function takes values from column Y (expense data in our examples). You must pay attention and not put the column X data first. If you do that, the function will calculate a result, but it will be the wrong one.
- If you have only one set of data points, the function won’t be able to calculate the result, and will return the error for division by zero – #DIV/0!
Conclusion
A slope needs to have one series of independent values, and one series of dependent values.
As a result, the Excel function SLOPE will show how to value Y changes when value X is increasing/decreasing.
The function takes only numeric values, Y values first, and both data series must be the same size.
I hope you found this tutorial useful!
Other Excel tutorials you may also like:
- How to Calculate Standard Error in Excel (Step-by-Step)
- How to Calculate IRR with Excel (easy Examples)
- How to Calculate NPV in Excel (Net Present Value)
- How to Find Outliers in Excel (3 Easy Ways)
- How to Calculate Antilog in Excel (Easy Formula)
- How to Get the p-Value in Excel?
- How to Find Z-score in Excel?
- How to Calculate the Interquartile Range in Excel
