
The HYPGEOM.DIST function in Excel calculates probabilities for random samples drawn without replacement from a fixed population.
Without replacement means each selected person or item stays out of the pool. Picking someone for a committee, for example, changes who’s available for the remaining seats.
You supply the population size, the count belonging to your group of interest, and the sample size. HYPGEOM.DIST returns the probability of an exact count or a cumulative count.
I’ll show you how to calculate exact and minimum counts, compare sample sizes, and decide when the with-replacement BINOM.DIST comparison fits a different question.
HYPGEOM.DIST Function Syntax in Excel
The function takes these arguments in this order:
=HYPGEOM.DIST(sample_s,number_sample,population_s,number_pop,cumulative)
- sample_s (required): The number of successes you’re asking about in the sample.
- number_sample (required): The total number of people or items selected.
- population_s (required): The number of successes available in the entire population.
- number_pop (required): The total population size.
- cumulative (required): Use
FALSEfor exactlysample_ssuccesses, orTRUEforsample_ssuccesses or fewer.
Here, “success” means membership in the group you’re counting. It can mean an unprepared student or a report missing a receipt; it doesn’t have to mean something positive.
All five arguments are required. Excel refuses the formula if you leave out cumulative.
When to Use HYPGEOM.DIST Function
- Find the chance that a randomly selected committee includes an exact number of first-time volunteers.
- Calculate the probability of staying within a maximum count, such as unprepared students called on in class.
- Compare sample sizes for finding at least one report with a missing receipt.
- Check the chance that random interviews include a minimum number of remote employees.
- Model tester selection when each customer can be picked only once.
Example 1: Calculate Every Exact Count
Let’s start with a committee selected randomly from a volunteer pool.
Below is the dataset. Column A lists possible first-timer counts, column B will hold their probabilities, and D1:E3 contains the pool and committee inputs.
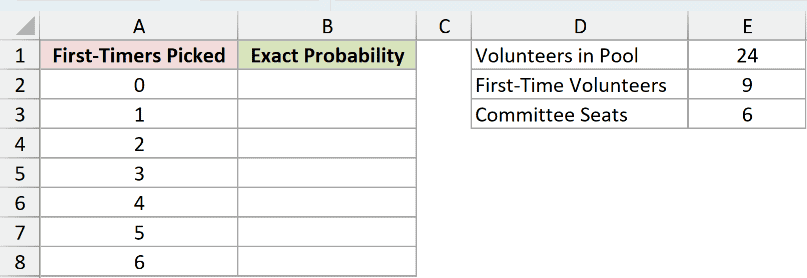
We want the probability of each possible first-timer count when choosing 6 people from 24 volunteers, including 9 first-timers.
Enter this formula in B2:
=HYPGEOM.DIST(A2:A8,$E$3,$E$2,$E$1,FALSE)
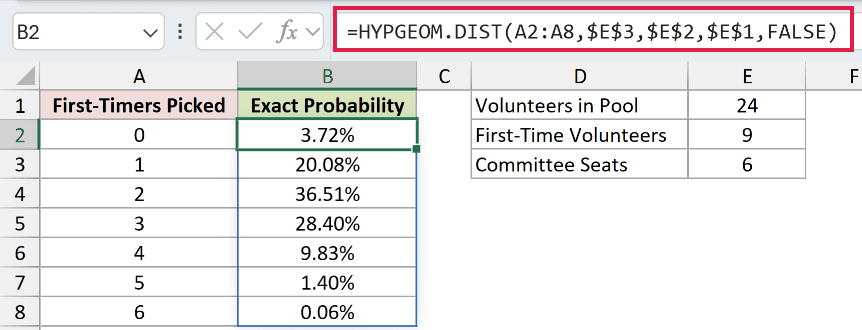
The formula spills into B2:B8. Each result corresponds to the count beside it in column A.
How this formula works:
A2:A8supplies the possible first-timer counts, from 0 through 6.$E$3supplies the committee size,$E$2the first-timer count in the pool, and$E$1the entire pool size.FALSEasks for each exact count separately.
The chance of picking exactly 2 first-timers is 36.51%, the highest probability in this table. Exactly 3 returns 28.40%.
At the ends, picking no first-timers returns 3.72%, while picking 6 returns 0.06%.
Range formulas spill in Excel 2021, Excel 2024 and Microsoft 365. In Excel 2019 and earlier, use a per-row version and fill it down.
Pro Tip: In Excel 2021 and later, SEQUENCE can generate the counts. Replace the typed values in A2:A8 with SEQUENCE(E3+1,,0) entered in A2.
Example 2: Find an At-Most Probability
Now let’s ask whether a random classroom selection stays within a limit.
Below is the dataset. B1:B4 holds the class size, unprepared count, selection size, and allowed maximum; the labelled B5 cell will hold the probability.
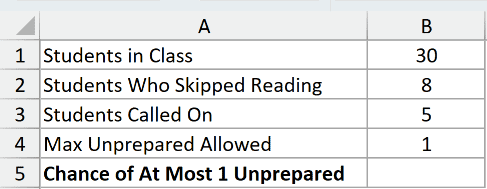
We want the chance of at most 1 unprepared student among 5 different students called on, from a class of 30 with 8 unprepared.
Enter this formula in B5:
=HYPGEOM.DIST(B4,B3,B2,B1,TRUE)
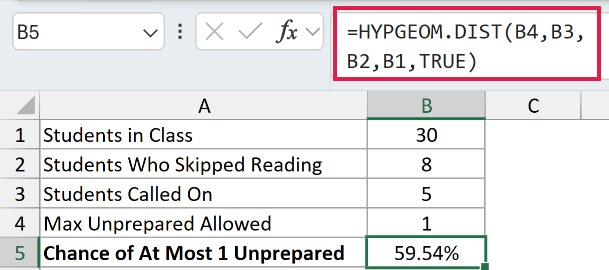
The result is 59.54%. That includes selections with no unprepared students and selections with exactly 1.
The final TRUE makes this cumulative. With FALSE, you’d ask only about the exact count in B4 and leave out selections below that count.
Pro Tip: For an inclusive range, subtract the cumulative probability just below the lower limit from the upper-limit cumulative probability. Subtracting at the lower limit excludes that count.
Example 3: Find at Least One Problem
Checking more expense reports increases the chance of finding a missing receipt.
Below is the dataset. Column A lists sample sizes, D1:E2 holds the batch and missing-receipt counts, and column B will show the detection probabilities.
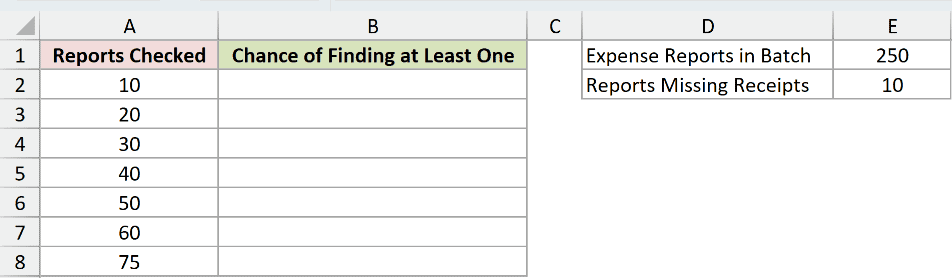
We want the chance of finding at least one missing receipt at each sample size, assuming 10 of the 250 reports have that problem.
Enter this formula in B2:
=1-HYPGEOM.DIST(0,A2:A8,$E$2,$E$1,FALSE)
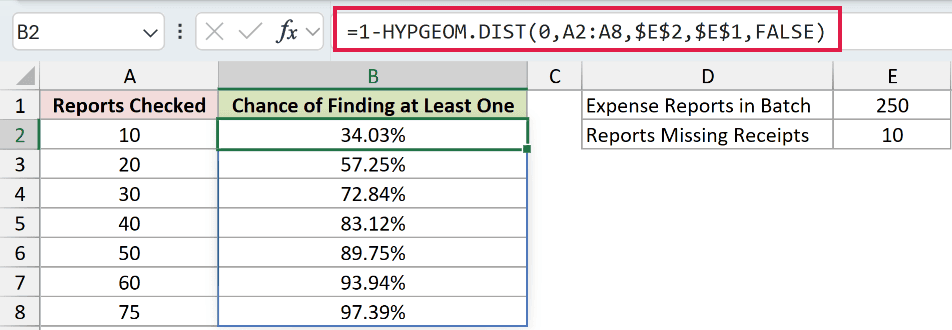
HYPGEOM.DIST first calculates the chance of finding exactly 0 problem reports. Subtracting that probability from 1 returns the chance of finding at least one.
This time, the range goes into number_sample. The formula evaluates every sample size in A2:A8 and spills its results into B2:B8.
Checking 10 reports returns 34.03%. Checking 30 returns 72.84%, and checking 50 returns 89.75%.
For the larger samples, checking 60 returns 93.94%, while checking 75 returns 97.39%. You can weigh the improvement against the additional checking work.
These probabilities depend on the assumed missing-receipt count. The formula doesn’t estimate how many problem reports actually exist in the batch.
Example 4: Meet a Minimum in Each Department
Next, let’s check whether random interview selections include enough remote employees.
Below is the dataset. Each department has headcount, remote employees, scheduled interviews, and a required minimum; column F will hold the chance of meeting that minimum.

We want the chance that each department’s random selection includes at least its required number of remote employees.
Enter this formula in F2:
=1-HYPGEOM.DIST(E2:E7-1,D2:D7,C2:C7,B2:B7,TRUE)
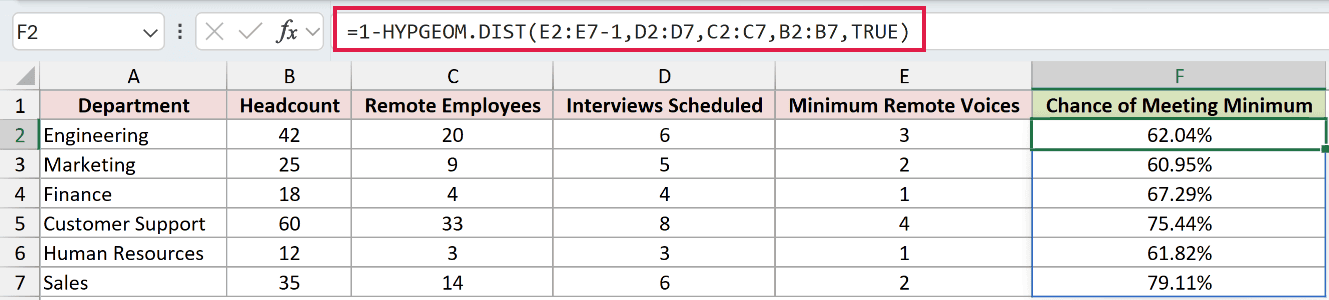
The formula spills into F2:F7, matching each department’s inputs across the same row.
How this formula works:
E2:E7-1sets the cutoff just below each required minimum.D2:D7supplies interview counts,C2:C7remote-employee counts, andB2:B7total headcounts.TRUEcalculates the probability of falling below the minimum.- Subtracting from 1 returns the probability of meeting or exceeding it.
Engineering needs at least 3 remote employees among 6 interviews. Its probability is 62.04%. Customer Support’s probability of meeting its own minimum is 75.44%.
Subtracting inside the function keeps exactly 3 in “at least 3,” because you remove only outcomes with 2 or fewer.
Pro Tip: Don’t drop the -1 from E2:E7-1. Without it, the complement means more than the minimum, so it wrongly excludes selections that meet the minimum exactly.
Example 5: Compare Without and With Replacement
Finally, let’s see how the sampling rule changes the probability of selecting premium customers.
Below is the dataset. Columns A:B hold customer counts, F1:G2 holds tester requirements, and columns C:D will show without-replacement probabilities beside the with-replacement comparison.

We want the chance of exactly 2 premium customers among 5 tester picks, comparing the sampling rules across different list sizes.
For selection without replacement, enter this formula in C2:
=HYPGEOM.DIST($G$2,$G$1,B2:B6,A2:A6,FALSE)

The results spill into C2:C6. For the list of 20 customers, including 6 premium customers, the probability is 35.22%.
Each selected customer leaves the pool, so the remaining premium share depends on who has already been picked.
For the with-replacement BINOM.DIST comparison, enter this formula in D2:
=BINOM.DIST($G$2,$G$1,B2:B6/A2:A6,FALSE)

The with-replacement comparison spills into D2:D6 and returns 30.87% throughout. Every row has the same premium share, and this model keeps that probability fixed across picks.
Column D is a comparison for a different sampling rule, not a mistake. For distinct testers who cannot be selected again, use the HYPGEOM.DIST results in column C.
As the population grows, the without-replacement results approach the with-replacement comparison: 30.94% for 1,000 customers and 30.88% for 10,000, beside 30.87%.
Removing each selected customer changes a large pool less. That’s why the sampling distinction has a smaller numerical effect in the larger lists.
Tips & Common Mistakes
- Keep counts in the right order. The sample success count comes first, followed by sample size, population success count, and population size. Population inputs are counts, not percentages.
- Choose the tail deliberately.
FALSEmeans exactly the count.TRUEmeans that count or fewer. For an inclusive minimum, subtract the cumulative probability below the minimum from 1. - Impossible success counts can return 0. In testing, asking for more successes than the sample size or available population successes returned 0, not an error.
- Invalid sample sizes are different. A sample larger than the population returns
#NUM!. A negative success count also returns#NUM!. - Use whole-number counts. Decimal counts are truncated. Excel doesn’t interpret a fractional count as a partial person or item.
- Don’t leave the cumulative setting to an empty cell. A blank referenced cell acts as
FALSE, so it requests an exact probability. - Check the sampling assumptions. These examples use random selections without replacement and a known or assumed population success count. Deliberately targeting a subgroup changes the selection process.
- Version and older name. HYPGEOM.DIST is available in Excel 2010 and later. The older HYPGEOMDIST takes four arguments and returns exact probabilities only.
- The manual COMBIN calculation
COMBIN(K,k)*COMBIN(N-K,n-k)/COMBIN(N,n)gives the same exact probability. Here,KandNare population successes and size;kandnare sample successes and size.
Before entering the formula, write your question as “exactly,” “at most,” or “at least.” That wording determines the cumulative setting and whether you need a complement.
Related Excel Functions / Articles:
