Year Over Year (YOY) growth is a common comparison metric that is considered when analyzing the growth of our business
It compares the growth in a certain period of time comparable to a similar period in the past, preferably a year back.
Using YOY comparison to measure business growth is preferable as it excludes seasonal effects and factors like monthly volatility. The advantage of excluding monthly volatility is that we do not compare the sales of an off-season month to the sales of other months.
In this tutorial, I will show how to use simple formulas to calculate Year Over Year (YOY) growth in Excel.
How Does the YOY (Year-Over-Year) Growth Work?
If you have a company and you want to see how the company has grown, there are two common ways to do it:
- Check the growth of the current month as compared to the previous month
- Check the growth of the current month as compared to the same month last year
While a month-over-month or a week-over-week comparison can show you the trend, it’s not an apple-to-apple comparison.
For example, if you made $100K in December vs $80K in January, you may think that your business has gone down by 20%, but since we are comparing different months, it’s not really a fair comparison.
The right way to do this would be to compare the numbers for January this year versus the numbers for January last year.
So, YOY gives you the broader picture to compare your business growth.
It also helps to identify cyclic patterns in yearly sales, if there are any.
The month-to-month or quarterly comparison is very beneficial to check if some new policy introduced in a company has better or worse effects on your business profits. YOY can be positive, indicating a net increase in the value of sales or profit. It can also be negative showing a net decrease.
Now I will show you how you can calculate the YOY growth using different methods in Excel.
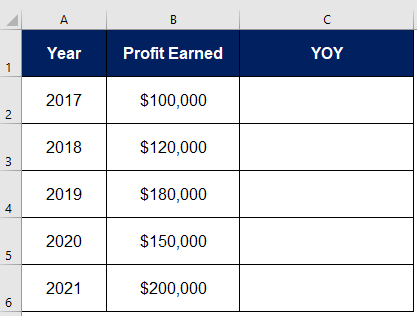
For demonstration purposes, I am going to use a data set of the profit earned by a company for consecutive 5 years which is shown below.

Also read: How to Calculate Growth Rate in Excel
Method 1 – Simple YOY Growth Formula
In this method, we have to subtract the profit earned in a specific year from the profit earned in previous years and then divide it by the profit earned in the previous year.
YOY Growth = (Present Value - Previous Value) / Previous Value *100
Below I have a data set where I have the years in column A and their sales values in column B and I want to calculate the year-over-year growth for each year in column C.
Here is the formula that will give me the year-on-year growth (needs to be entered in cell B3):
=(B3-B2)/B2

The above formula will return the YOY growth value for the year 2018. The answer is in decimals by default and you will have to convert it into percentages by adopting a simple procedure (steps below).

Since the calculation of the Year-Over-Year growth formula needs both the current year and the previous year’s value, we have entered the formula in cell B3 (which is for 2018). You need to leave cell B2 empty, as we cannot calculate the year-over-year growth for the first year (because we do not have any previous year value to compare it with)
Convert Decimal Value to Percentage
Below are the steps to convert the decimal value into a percentage:
- Click on the Home tab in the ribbon.

- Look for the number section in the toolbar and click on Number Formats, as shown in the screenshot.

- From the dropdown list, selects the Percentage option.

- It will convert the YOY growth value into a percentage.

In order to calculate YOY for other years, you can write formulas for each year or simply drag down the written formula to the whole column.

Increase or Decrease Decimal Value in YOY Growth Result
If you want to make your year-on-year growth result value more precise by increasing the decimal values, or do you want to show a more rounded-off number by decreasing the decimal percentage point, then you can do that using the below steps:
- Select the range from which you want to remove the decimal point.

- Click on the Home tab in the ribbon

- In the Home tab, look for the option Decrease Decimal. By clicking Once on the option it will remove one decimal digit from the range. In this example we want to remove 2 decimals so click twice.

This will remove the decimal point from the percentage as shown in the screenshot.

Similarly, you can increase the decimal point by using the Increase Decimal option in the Home tab as shown below.

This is the simplest method of calculating YOY in Excel.
Method 2: Advanced YOY Growth Formula
We can also calculate YOY for given data by dividing the profit of a year by the profit of the previous year and subtracting 1 from it.
YOY = (Present Value / Previous Value)-1
Below I have a data set where I have the years in column A and their sales values in column B and I want to calculate the year-over-year growth for each year in column C.

Here is the formula that will give me the year-on-year growth (needs to be entered in cell B3):
=(B3/B2)-1
- It will return the YOY in decimals and we have to convert it into percentages.

The above formula returns the YOY growth value in decimals and we need to convert it into percentages.
Below are the steps to convert the decimal value to a percentage:
- Click on the Home tab in the ribbon

- Now click on the Number Format option.
- From the dropdown menu click on the Percentage option.

- It will convert YOY into a percentage.

- In order to calculate YOY for other years, we can write formulas for each year or simply drag down the written formula to calculate it.

Calculating YoY Change for Month-wise Comparison
You can also do a year-over-year comparison of monthly data when you need to make sure that you’re comparing the same month in the previous year and the current year.
This makes sure that the comparison is fair and it eliminates factors such as seasonality.
For example, it’s better to compare Feb 2021 data with Feb 2022 data instead of Mar 2021 data
For this purpose, we must have data for at least two years. For example, sample data for the monthly profits of a company is listed below for 2 years.

Let’s see how we can calculate YOY for monthly comparison.
- In this example, I am going to calculate the YOY percent change of 2022 as compared to the year 2021. In order to calculate YOY the basic formula used is highlighted in the red box and shown below.

- It will return the results of YOY in decimals.

- Now we convert the answer into a percentage by first going to the Home tab in the ribbon.

- Now click on the Number Formats option.
- From the dropdown menu click on the percentage option.

It will convert the answer to a percentage as shown in the below screenshot.

- Now in order to calculate YOY for other months drag the formula to the entire column. To drag the formula use the plus icon (+) that appears when moving the cursor to the right bottom of the selected cell.

Tip: You can also visualize YOY growth against sales month by plotting calculated data.
- Select the YOY growth data

- Now click on the Insert tab in the ribbon

- Then click on the line chart option as shown.

- A dropdown gets open. Select any chart that you want. I am going to select the Line chart as shown.

This will insert a line chart showing a YOY for month-wise comparison.

In this tutorial, I showed you how you can calculate year-over-year growth in Excel using simple arithmetic formulas.
Apart from that I also explain how you can calculate YOY change for month-wise comparison that eliminates the factors like cyclic pattern and seasonality.
Hopefully, you now have a better understanding of how to calculate YOY and what it means for your business.
Other articles you may also like:
- Compound Interest Formula in Excel (2 Easy Ways)
- How to Calculate Standard Error In Excel
- How to Find Slope in Excel (Easy Formula)
- How to Find Percentile in Excel (PERCENTILE Function)
- How to Calculate Cumulative Percentage in Excel?
- How to Calculate Percentage Difference in Excel (Formulas)
- How to Subtract Percentage in Excel (Decrease Value by Percentage)?