
Excel’s AVEDEV function returns the average of the absolute deviations of a set of numbers from their arithmetic mean.
The result describes the typical distance from the mean in the same units as the source data. A lower value means the numbers sit closer together.
This function reference focuses on AVEDEV’s arguments, comparisons, and input rules. The longer average-deviation tutorial also covers alternative calculation methods.
In this article, I’ll show you how to calculate average deviation, compare process consistency, and measure variability within a selected group using AVEDEV.
AVEDEV Function Syntax in Excel
The AVEDEV function accepts one required argument and up to 254 optional arguments:
=AVEDEV(number1, [number2], ...)
number1is the first number, array, name, or reference containing the values you want to measure.[number2], ...are optional additional numbers, arrays, names, or references. AVEDEV accepts up to 255 arguments in total.
When to Use AVEDEV Function
- Measure the typical absolute distance from a mean.
- Compare the consistency of two processes that use the same units.
- Check how blanks, text, and zero affect a variability result.
- Measure one category after FILTER selects the relevant values.
- Compare mean absolute deviation with sample standard deviation.
Example 1: Calculate Average Deviation
The first example shows the AVEDEV result and the arithmetic behind it.
Below is the dataset with five preparation times, plus cells for the mean, AVEDEV result, and a manual check.
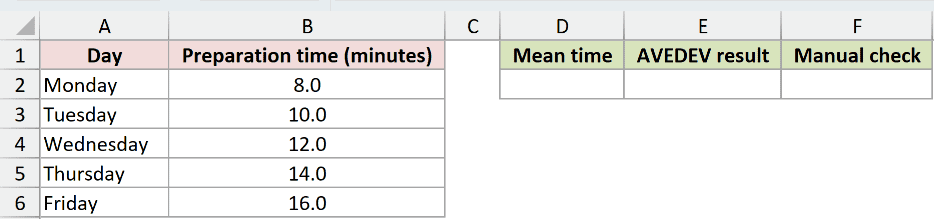
I want to find the mean preparation time, then measure the average absolute distance from that mean.
Here is the AVERAGE formula:
=AVERAGE($B$2:$B$6)
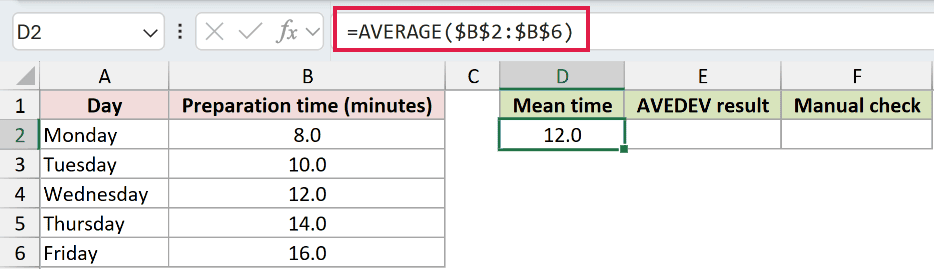
The five preparation times average 12.0 minutes.
Here is the AVEDEV formula:
=AVEDEV($B$2:$B$6)
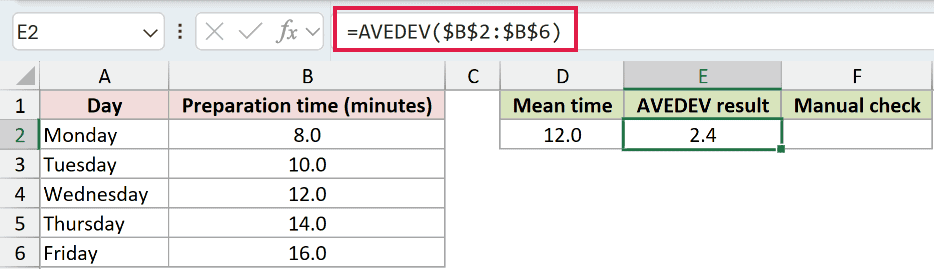
The distances from 12 are 4, 2, 0, 2, and 4 minutes. Their average is 2.4 minutes, which is what AVEDEV returns.
Here is the manual check:
=SUMPRODUCT(ABS($B$2:$B$6-AVERAGE($B$2:$B$6)))/COUNT($B$2:$B$6)
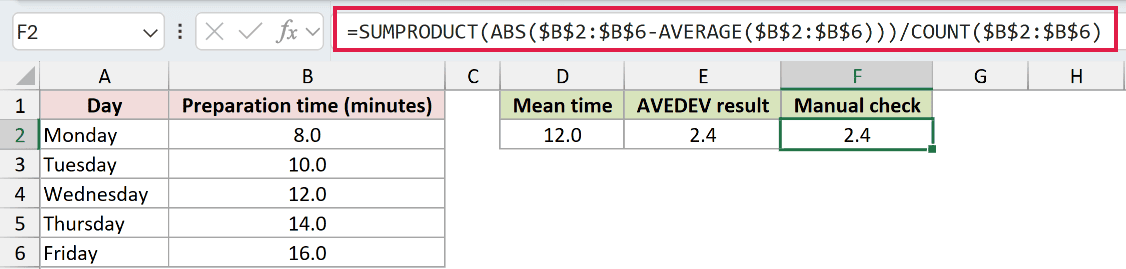
ABS removes each deviation’s sign. SUMPRODUCT adds those absolute distances, and COUNT supplies the number of numeric values used as the divisor.
The manual formula also returns 2.4, confirming the AVEDEV result.
Example 2: Compare Process Consistency
AVEDEV can compare two processes that have the same average but different amounts of variation.
Below is the dataset with six dispatch times for Dispatch A and Dispatch B, followed by one AVEDEV result for each process.
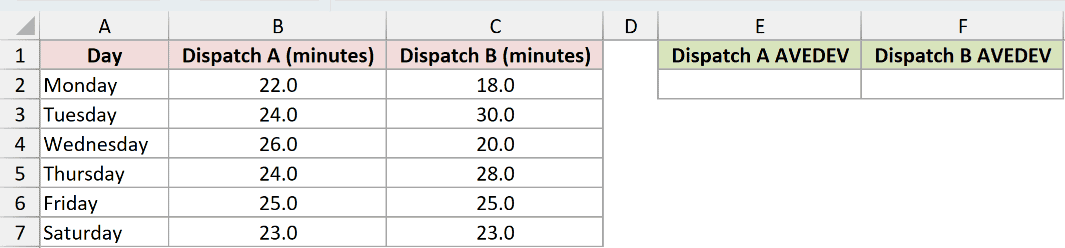
I want to determine which dispatch process stays closer to its mean time.
Here is the formula for Dispatch A:
=AVEDEV($B$2:$B$7)
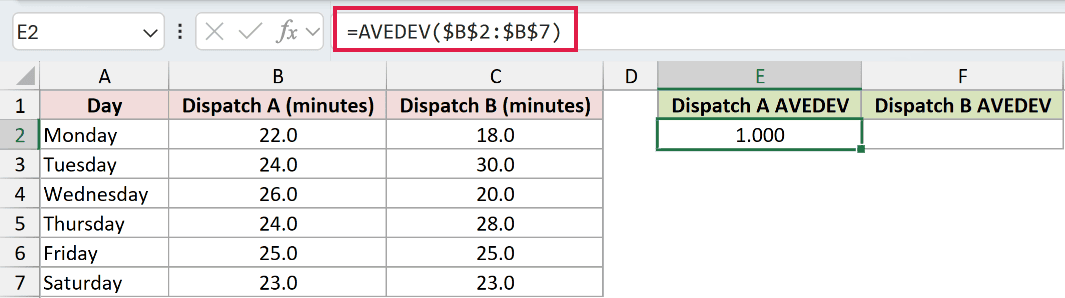
Dispatch A has an AVEDEV of 1.000 minute.
Here is the formula for Dispatch B:
=AVEDEV($C$2:$C$7)
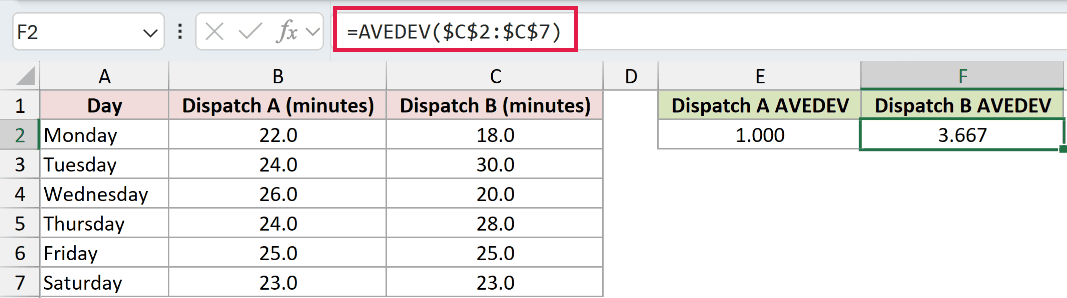
Dispatch B has an AVEDEV of 3.667 minutes.
Both processes average 24 minutes, but Dispatch A has the lower average deviation. Its times are more consistent around that shared mean.
Pro Tip: Compare AVEDEV results only when the datasets use the same unit and a similar scale. A lower value then means less average spread around the mean.
Example 3: Handle Text, Blanks, and Zero
A zero is a numeric observation. It does not behave like an empty cell.
Below is the dataset with inspection counts that include zero, the text Not recorded, and one blank cell.
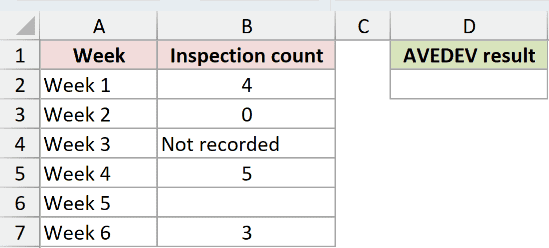
I want to calculate average deviation while keeping Excel’s normal reference-handling rules visible.
Here is the formula:
=AVEDEV(B2:B7)
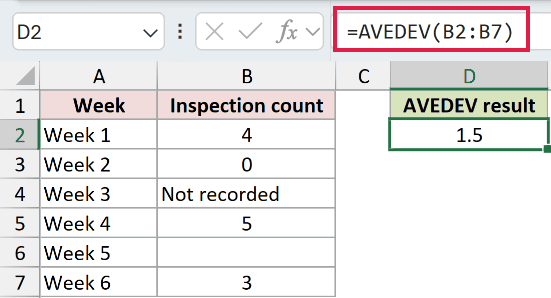
AVEDEV ignores the text in B4 and the blank cell B6. It includes the zero in B3, so the numeric values are 4, 0, 5, and 3.
Those four values have a mean of 3 and an average absolute deviation of 1.5.
Pro Tip: Check whether zero means a real count or missing data before using AVEDEV. Excel includes zero, so an accidental placeholder can materially change the result.
Example 4: Calculate AVEDEV for a Subgroup
The FILTER function can select one category before AVEDEV measures its variability.
Below is the dataset with support channels and response times, plus a selected channel and one Average deviation result cell.
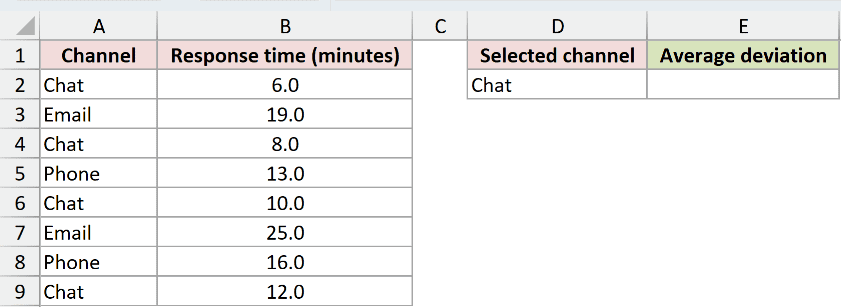
I want to calculate the average deviation for the channel selected in cell D2.
Here is the formula:
=AVEDEV(FILTER($B$2:$B$9,$A$2:$A$9=D2))
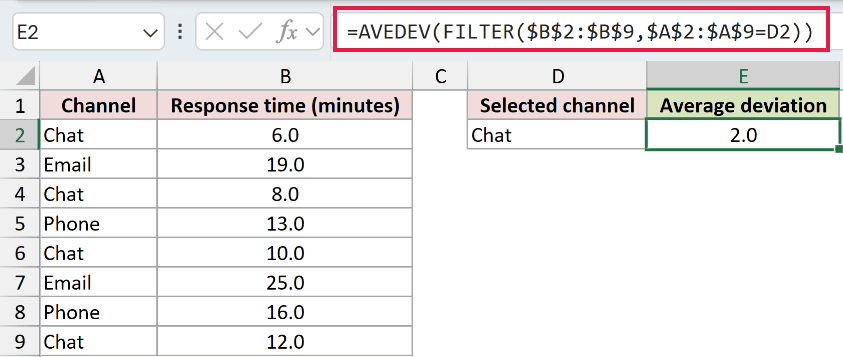
FILTER returns the four Chat times: 6, 8, 10, and 12 minutes. AVEDEV reduces that array to one result of 2.0 minutes.
Changing D2 changes the subgroup. AVEDEV still returns one value because it is a reducer, even though FILTER creates an array inside the formula.
Pro Tip: FILTER is available in Excel 2021, Excel 2024, and Microsoft 365. In older versions, place the selected values in a helper range before using AVEDEV.
Example 5: Compare AVEDEV and STDEV.S
Average deviation and sample standard deviation measure spread differently.
Below is the dataset with six weekly response times, including one unusually high value, plus AVEDEV and STDEV.S result cells.
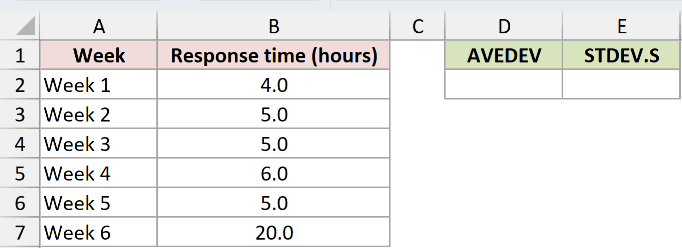
I want to compare the two variability measures on the same sample.
Here is the AVEDEV formula:
=AVEDEV($B$2:$B$7)
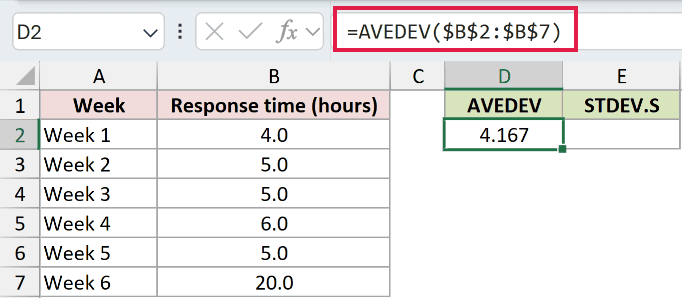
AVEDEV returns 4.167 hours by averaging the absolute distances from the mean.
Here is the STDEV.S formula:
=STDEV.S($B$2:$B$7)
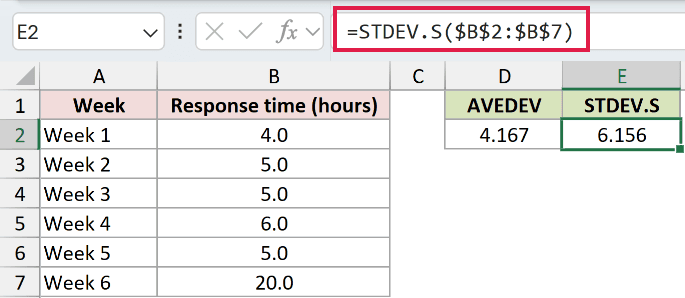
STDEV.S returns 6.156 hours. It uses squared deviations and the sample denominator, so the 20-hour observation has more influence on the result.
Use AVEDEV when you want a same-unit average absolute distance. Use STDEV.S when your analysis specifically calls for sample standard deviation.
Tips & Common Mistakes
- AVEDEV returns one value for the entire input set. It is a non-spilling reducer, even when another function supplies a dynamic array.
- Text, logical values, and empty cells inside a referenced range are ignored. Zero is included.
- Text representations of numbers and logical values typed directly into the argument list are counted, unlike the same values inside a reference.
- Keep the source unit in mind. An AVEDEV of 2.4 for minutes means 2.4 minutes, not 2.4%.
- AVEDEV makes no sample-versus-population choice. It always returns the average absolute deviation from the mean for the values supplied.
- The result cannot be negative. AVEDEV returns zero only when all included values are identical.
I covered AVEDEV’s calculation, process comparisons, mixed inputs, filtered subgroups, and the difference between average deviation and sample standard deviation.
I hope you found this article helpful.
Related Excel Functions / Articles:
