
If you want to know how far your numbers typically sit from their average, average deviation is the measure you’re after. It gives you the average distance of each value from the mean, in the same units as your data.
Excel doesn’t have an obvious button for it, so a lot of people grab standard deviation instead and get a different number.
The good news is there’s a dedicated function plus a couple of manual routes that are easy to follow. In this tutorial I’ll show you three ways to calculate average deviation in Excel.
Method #1: Using the AVEDEV Function
The quickest way to calculate average deviation in Excel is the AVEDEV function. You hand it a range, and it returns the average of the absolute distances between each value and the mean. No helper columns, no setup.
Below I have a quality-control sample of measured part dimensions. Each row is a part with its machine and its measured diameter in millimeters, and I want the average deviation of those diameters.
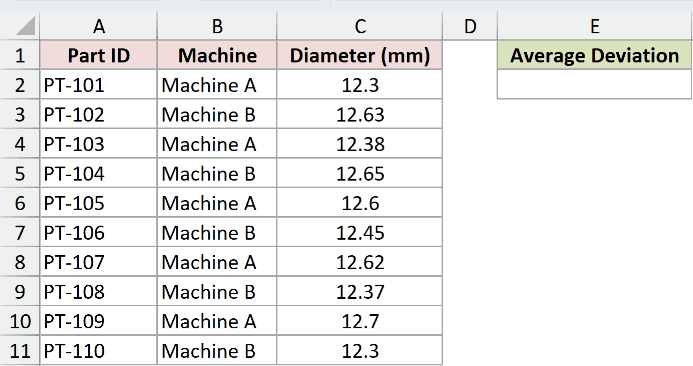
Here is the formula:
=AVEDEV(C2:C11)
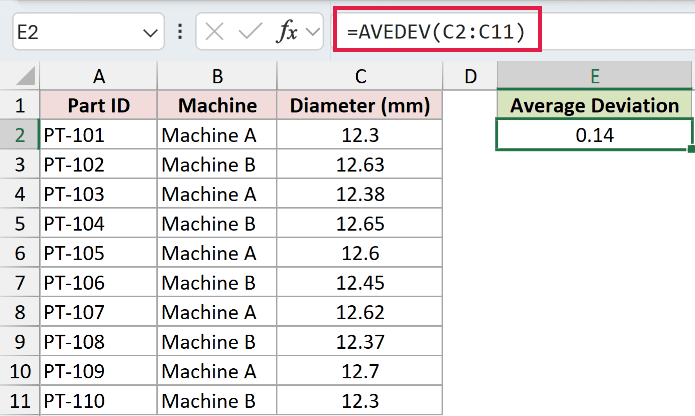
This returns 0.14, which means the diameters sit about 0.14 mm away from the mean on average.
How does this formula work?
The mean of the ten diameters is 12.5 mm. AVEDEV measures how far each part is from that 12.5, ignoring whether it’s above or below, then averages those distances.
So a part at 12.3 and a part at 12.7 each count as 0.2 away, and the ten distances average out to 0.14 mm.
Note: AVEDEV uses the mean as its center point and takes the absolute distance from it, so the result is never negative. It ignores empty cells and text, but counts a zero as a real value.
Method #2: Using AVERAGE and ABS
If you’d rather see the mechanics instead of trusting one function, you can rebuild average deviation yourself with AVERAGE and ABS.
This is useful when you want to show each part’s distance from the mean in its own column, or when a reviewer wants to see the working.
I’m using the same quality sample of measured part dimensions here, and I want to land on the same 0.14 result as before.
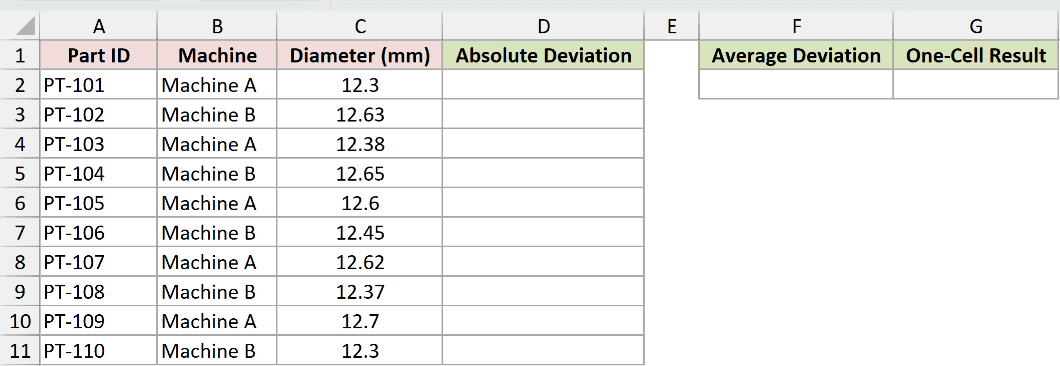
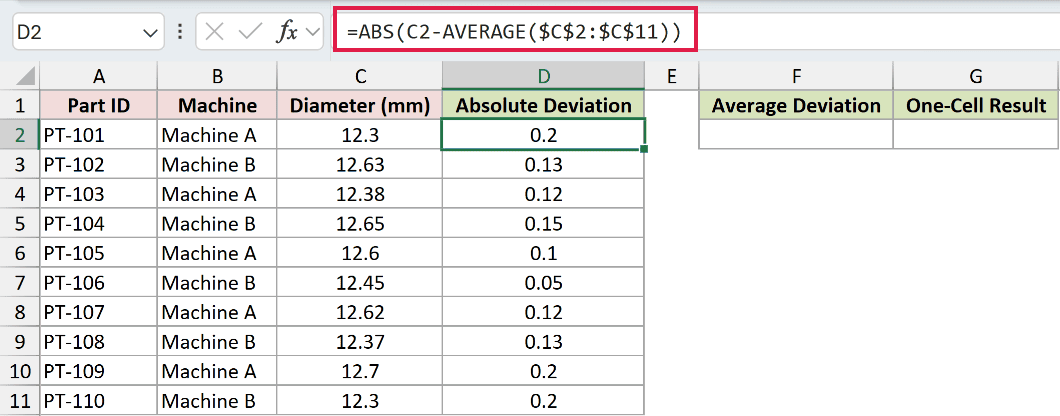
Start with a helper column. In D2, subtract the mean from the first diameter and wrap it in ABS so the sign drops off:
=ABS(C2-AVERAGE($C$2:$C$11))
Copy that down through D11 and you get each part’s absolute distance from the mean.
Now average the helper column to get the average deviation:
=AVERAGE(D2:D11)
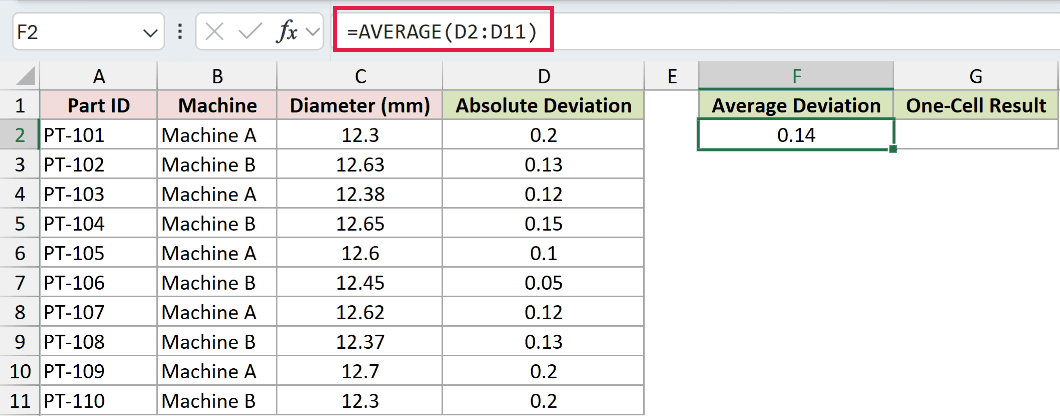
That returns 0.14, exactly what AVEDEV gave us.
If you’d rather skip the helper column, you can do the whole thing in one cell with SUMPRODUCT:
=SUMPRODUCT(ABS(C2:C11-AVERAGE(C2:C11)))/COUNT(C2:C11)
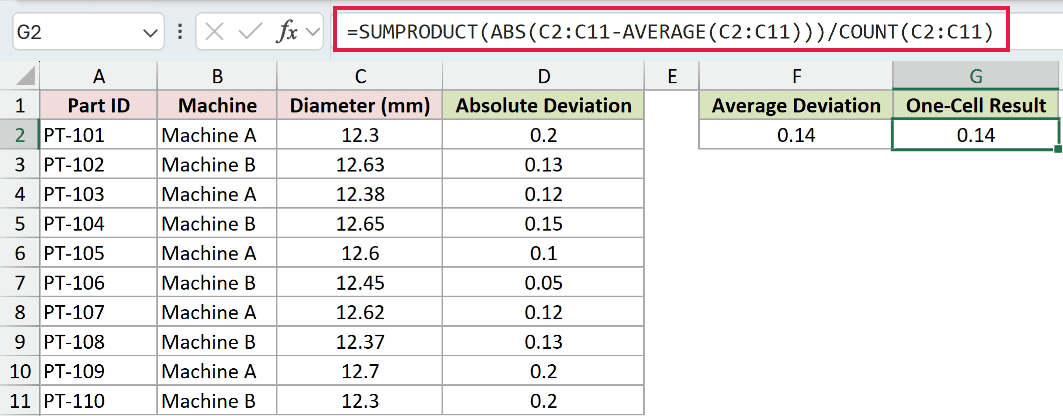
How does this formula work?
ABS(C2:C11-AVERAGE(C2:C11)) builds an array of the ten absolute distances from the mean. SUMPRODUCT adds that array up to 1.4, and dividing by COUNT (which is 10) gives 0.14. It’s the exact same math AVEDEV runs internally.
Note: You may see this written as the array formula =AVERAGE(ABS(C2:C11-AVERAGE(C2:C11))). It works normally in Microsoft 365. In Excel 2019 and earlier, confirm it with Ctrl+Shift+Enter in Windows or Control+Shift+Return on a Mac. SUMPRODUCT avoids that.
Method #3: Using AVEDEV With FILTER
Sometimes you don’t want the average deviation of everything, just one slice of it, like a single machine or shift. You can feed a filtered subset straight into AVEDEV using the FILTER function, so the calculation only sees the rows you care about.
Here’s the same parts sample. This time I only want the average deviation for parts made on Machine A, ignoring the rest.
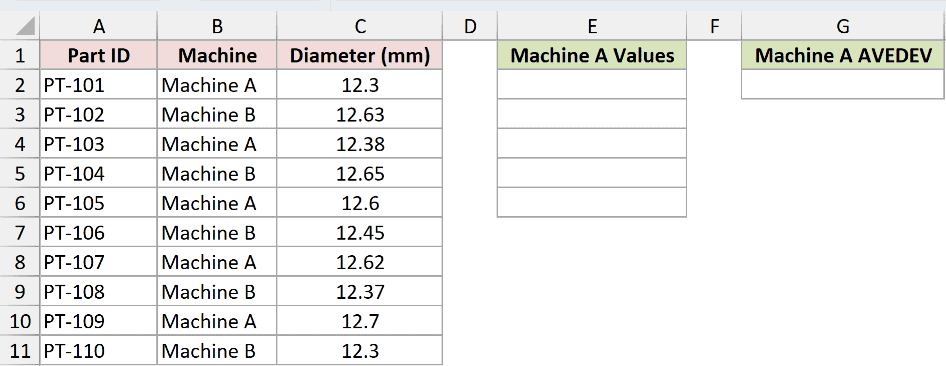
First, FILTER pulls out just the Machine A diameters:
=FILTER(C2:C11,B2:B11="Machine A")
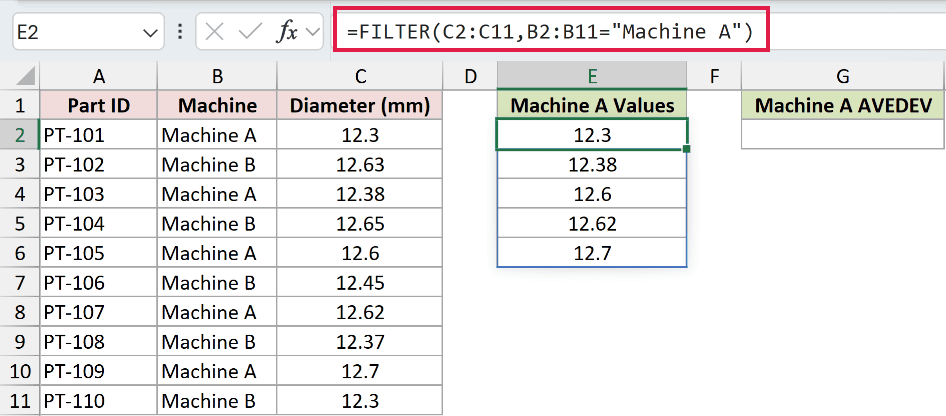
The five Machine A values spill into a column. Now wrap that filter inside AVEDEV to get the average deviation of just that subset:
=AVEDEV(FILTER(C2:C11,B2:B11="Machine A"))
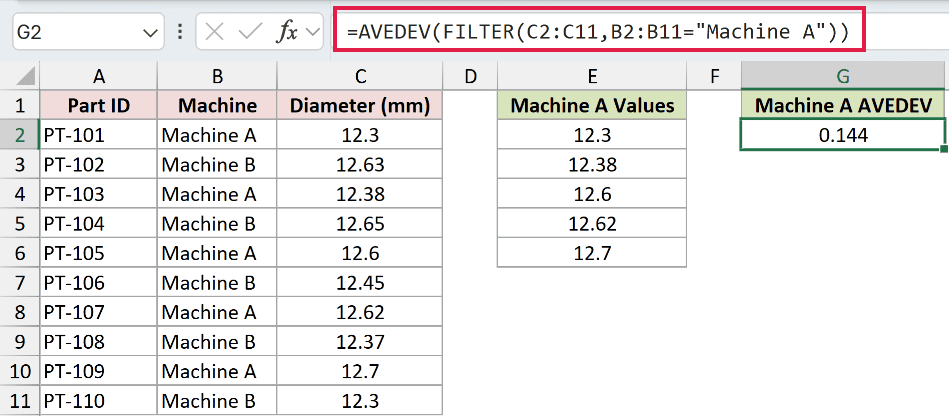
This returns 0.144. The five Machine A parts average 12.52 mm, and their diameters sit about 0.144 mm from that mean.
How does this formula work?
FILTER keeps only the rows where column B equals “Machine A” and returns those five diameters.
AVEDEV then treats that shorter list as its whole population, working out the mean of the five values and the average distance from it. Change the machine name in the formula and the result updates for that group instead.
Note: FILTER needs Microsoft 365 or Excel 2021. On older versions, copy the matching values to a helper range, then run AVEDEV on that range. AVEDEV does not ignore rows merely because a filter hides them.
Additional Notes About Average Deviation in Excel
- Average deviation and standard deviation both measure spread, but they’re not the same number. Average deviation uses plain absolute distances, while standard deviation squares them, so if you want to compare the two on the same data, run your numbers through this standard deviation calculator alongside AVEDEV.
- AVEDEV works on the whole set you give it and makes no sample-versus-population distinction, unlike STDEV.S and STDEV.P. There’s only one AVEDEV.
- Blank cells are skipped, but a cell holding 0 is counted as a real value and will pull the mean down. Clean stray zeros out before you measure spread.
- Keep an eye on units. The result comes back in the same units as your data, so an average deviation of 0.14 on millimeters means 0.14 mm, not a percentage.
Frequently Asked Questions
Is average deviation the same as standard deviation?
No. Average deviation averages the absolute distances from the mean, while standard deviation squares those distances first, then takes a square root. Standard deviation reacts more strongly to a few large outliers, so the two usually give different numbers on the same data.
When should I use average deviation instead of standard deviation?
Reach for average deviation when you want a plain, easy-to-explain measure of typical distance from the mean, especially for a non-technical audience. Standard deviation is the better fit when you need it for further statistics, like confidence intervals or z-scores.
Can average deviation be a negative number?
No. Because AVEDEV takes the absolute value of every distance before averaging, the smallest it can ever be is 0, which only happens when every value is identical. Any real spread gives a positive result.
Conclusion
You’ve now got three ways to calculate average deviation in Excel: the AVEDEV function for a one-step answer, an AVERAGE and ABS build when you want to see the working, and AVEDEV wrapped in FILTER for a specific subset.
For everyday use I’d reach for AVEDEV first, since it’s a single function that handles the whole set for you. Keep the manual approach in your back pocket for when someone wants to see how the number comes together.
Other Excel articles you may also like:
