
The YIELDDISC function in Excel returns the annual simple yield on a discounted security, using its purchase price, redemption value, and settlement and maturity dates.
A discounted security costs less than the amount you receive at maturity. YIELDDISC measures that gain against the price you paid, then annualizes it using your chosen day-count method.
The result is a simple annual rate. For a security held over several years, it doesn’t describe compound growth.
I’ll show you how to compare discounted securities, choose a day-count basis, and spot input mistakes that can return a believable-looking number without an error.
YIELDDISC Function Syntax in Excel
YIELDDISC takes the security’s dates and prices, plus an optional day-count basis:
=YIELDDISC(settlement, maturity, pr, redemption, [basis])
- settlement (required): The date you buy and settle the security.
- maturity (required): The date the security pays its redemption value. This must be later than settlement.
- pr (required): The purchase price per $100 of face value. Enter a price, not a percentage.
- redemption (required): The amount paid at maturity per $100 of face value.
- basis (optional): The day-count method used to annualize the return. Omitting it selects US (NASD) 30/360.
The basis codes are:
- 0: US (NASD) 30/360, the default.
- 1: Actual/actual.
- 2: Actual/360.
- 3: Actual/365.
- 4: European 30/360.
The actual-day methods count calendar days. The 30/360 methods use adjusted month lengths, with different adjustment rules for the US and European conventions.
When to Use YIELDDISC Function
- Calculate the annual yield on commercial paper or a discount note from its quoted price.
- Compare discounted securities with different prices and maturity dates using the same day-count basis.
- Calculate a simple annual yield for a zero-coupon bond held beyond a year.
- Test how different bid prices affect the yield on the same security.
Example 1: Calculate Yield on Commercial Paper
Let’s start with a commercial paper note bought below its redemption value.
Below is the dataset. Cells B1:B5 hold the dates, price, redemption value, and basis. The labelled Annual Yield cell in B6 will hold the answer.
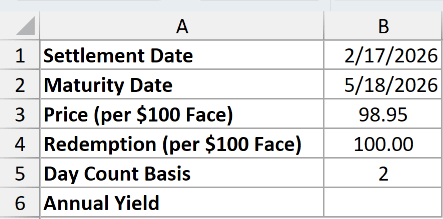
We want the annual simple yield on this note using the actual/360 basis.
Enter this formula in B6:
=YIELDDISC(B1,B2,B3,B4,B5)
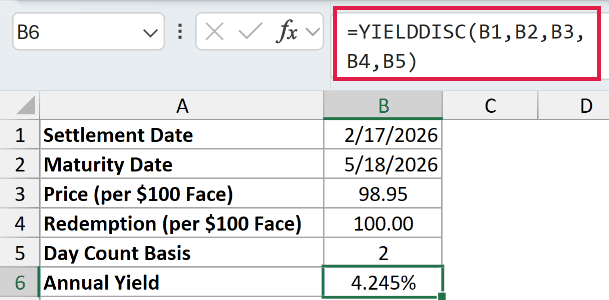
The formula returns 4.245%. The purchase price is 98.95 per $100 face value, and the redemption amount is 100.00.
YIELDDISC divides the gain by the purchase price, then annualizes that return. Basis 2 uses the actual days between the dates and a 360-day year.
Pro Tip: Format the yield in B6 as a percentage so the annual rate is easy to read.
Example 2: Compare Different Discounted Securities
A larger discount doesn’t necessarily mean a higher annual yield.
Below is the dataset. Columns A:D list securities, terms, maturities, and prices. Column E will hold yields; G:H contains the shared settlement, redemption, and basis settings.

We want to compare each security’s annual yield using the same settlement date and day-count method.
Enter this formula in E2, then copy it down through E6:
=YIELDDISC($H$2,C2,D2,$H$3,$H$4)
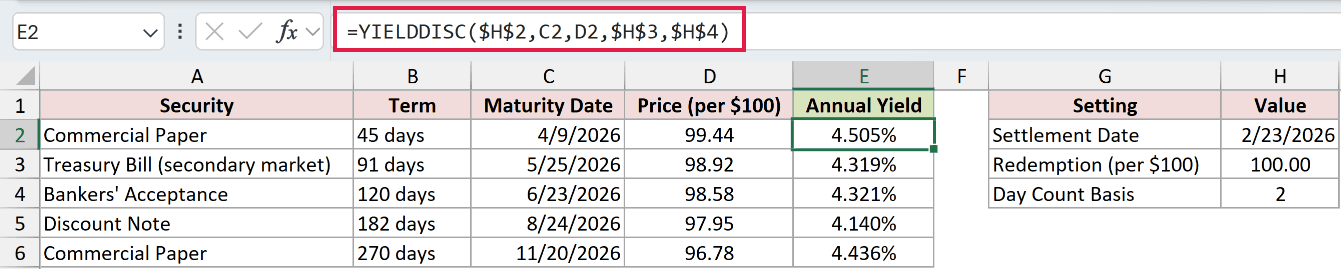
The dollar signs keep the shared settings fixed. The maturity and price references move to the next security as you copy down.
These are separate row formulas. Passing a bare range to YIELDDISC returns #VALUE!; Example 6 shows the supported spilling approach.
The commercial paper with a term of 45 days returns 4.505%, while the 270-day commercial paper returns 4.436%.
The shorter note earns its smaller gain over far fewer days. That shorter term gives it the higher annual yield.
The Treasury bill returns 4.319%, the bankers’ acceptance 4.321%, and the discount note 4.140%. Assess credit risk and liquidity separately.
Example 3: Compare Day-Count Bases
Now let’s keep the security fixed and change only the day-count method.
Below is the dataset. Columns A:B list basis codes and methods, and column C will show yields. E:F holds the note’s dates, price, and redemption value.
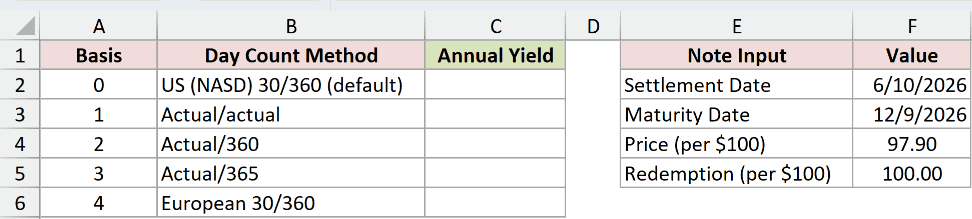
We want to see how the basis changes the annual yield for the same note.
Enter this formula in C2, then copy it down through C6:
=YIELDDISC($F$2,$F$3,$F$4,$F$5,A2)
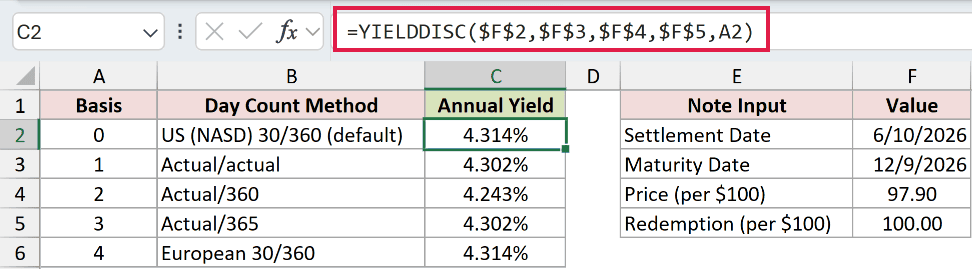
The locked references keep the dates, price, and redemption unchanged. Only the basis code changes between these comparison rows.
- Basis 0 and 4 both return 4.314%.
- Basis 1 and 3 both return 4.302%.
- Basis 2 returns 4.243%.
Several methods agree for these dates. Other date spans can produce different results because each convention adjusts the day count differently.
Omitting the basis selects the same method as code 0. It doesn’t select actual/360 automatically.
Pro Tip: Choose the basis specified for the security. Don’t select whichever comparison row produces the highest yield; the day-count convention is part of the calculation’s meaning.
Example 4: Separate Simple and Compound Yield
YIELDDISC also accepts maturities more than a year after settlement.
Below is the dataset. B1:B6 holds a zero-coupon bond’s inputs, including typed years to maturity. B7:B8 will compare simple and compound annual yields.
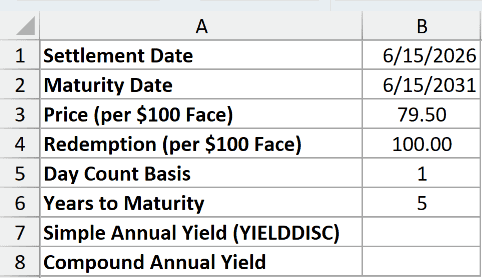
We want the simple annual yield, then a compound-rate comparison for the same bond.
Enter the YIELDDISC formula in B7:
=YIELDDISC(B1,B2,B3,B4,B5)
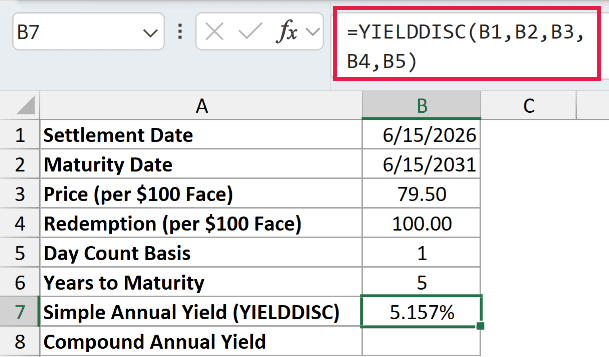
The simple annual yield is 5.157% for the bond bought at 79.50 and redeemed at 100.00. Its maturity is five years after settlement.
For the compound annual yield comparison in B8, enter:
=(B4/B3)^(1/B6)-1
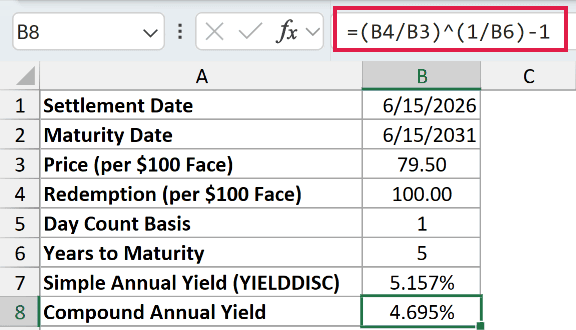
The compound comparison returns 4.695%. It divides redemption by price, takes the root specified by the years in B6, and removes the starting principal from the growth factor.
This is the steady compound annual rate that grows the purchase price to the redemption value.
YIELDDISC annualizes the gain on the original price without compounding. Don’t label its result as a compound annual yield just because the security spans several years.
Example 5: Compare Yield and Discount Rate
A dealer’s discount rate and your yield use different denominators.
Below is the dataset. B1:B5 contains the note’s inputs. B6 will show yield on the price paid, and B7 will hold the quoted discount-rate comparison.
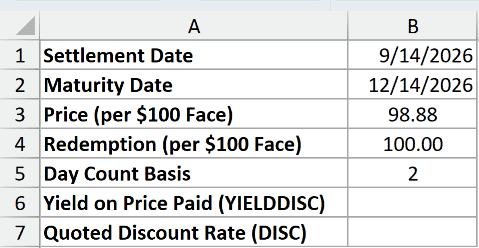
We want to calculate the yield, then compare it with the discount rate for the same note.
Enter the YIELDDISC formula in B6:
=YIELDDISC(B1,B2,B3,B4,B5)
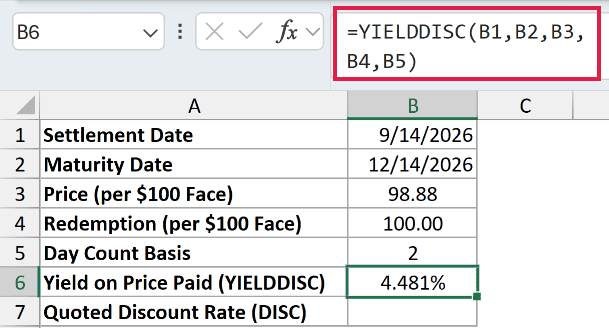
YIELDDISC returns 4.481%, measuring the annualized gain against the price paid, 98.88.
For comparison, DISC calculates the annual discount rate against the redemption value. Using it here shows why a discount quote differs from your yield.
Enter this comparison formula in B7:
=DISC(B1,B2,B3,B4,B5)
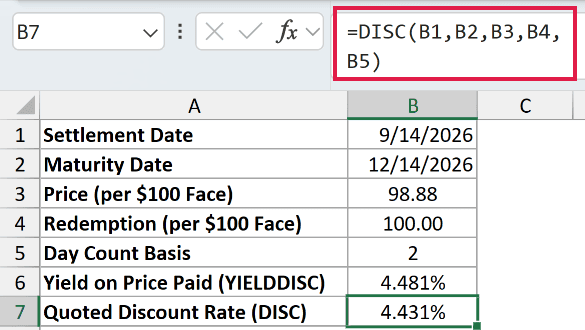
The discount-rate comparison returns 4.431% because it divides the gain by the larger redemption amount, 100.00.
Both calculations use the same dates and basis. Measuring the gain against the smaller purchase price produces the higher rate.
Example 6: Calculate Yield for Several Bid Prices
You can also test several prices with one formula that spills into the cells below.
Below is the dataset. A2:A7 holds bid prices, column B will show yields, and E2:E3 contains the shared settlement and maturity dates.
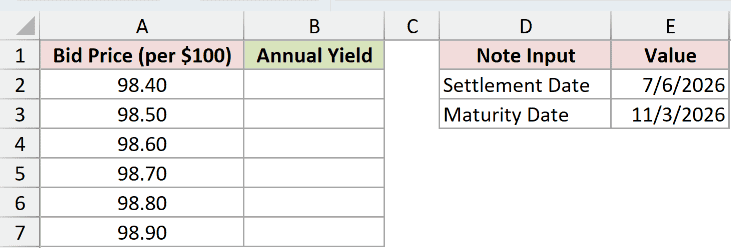
We want a yield for every bid price without copying the formula down.
Enter this formula in B2:
=YIELDDISC(E2,E3,+A2:A7,100,2)
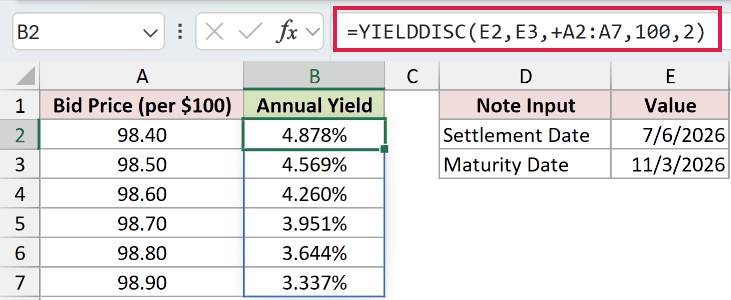
The plus sign turns the price range into a calculated array that YIELDDISC can process. A bare range returns a single #VALUE! instead.
The formula enters redemption as 100 and basis as 2 directly.
The results spill into B2:B7 in Excel 2021, Excel 2024, and Microsoft 365. In Excel 2019 and earlier, use the per-row copying approach demonstrated in Example 2.
At a price of 98.40, the yield is 4.878%. At 98.90, it falls to 3.337%.
The dates and redemption haven’t changed. Paying more leaves a smaller gain, which lowers the yield.
Example 7: Diagnose Errors and Silent Input Mistakes
Some bad inputs raise errors; others produce a number you still need to question.
Below is the dataset. Columns A:F contain a valid case, deliberate input mistakes, and a premium-price comparison. Column G will show each case’s outcome.
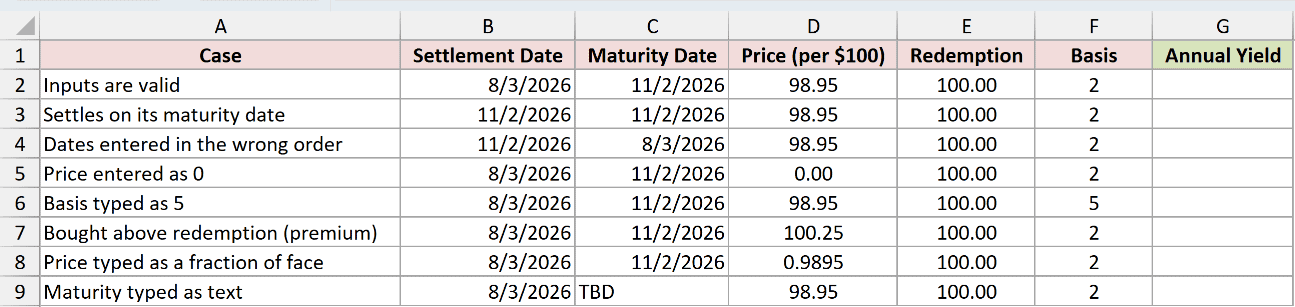
We want to see which inputs fail and which return a number despite needing closer inspection.
Enter this formula in G2, then copy it down through G9:
=YIELDDISC(B2,C2,D2,E2,F2)
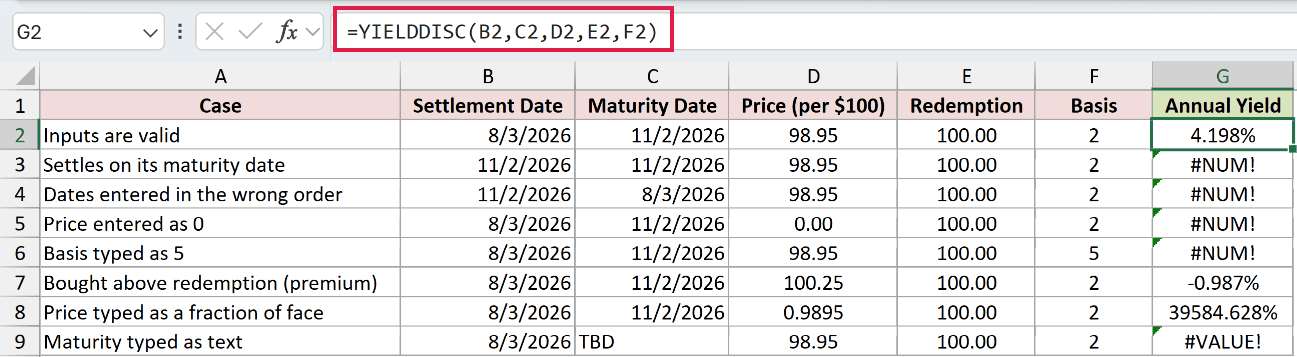
The valid case in G2 returns 4.198%.
G3, settlement on maturity: Returns#NUM!. Settlement must come before maturity.G4, reversed dates: Returns#NUM!. Correct the dates so maturity follows settlement.G5, zero price: Returns#NUM!. Supply the positive purchase price.G6, basis entered as 5: Returns#NUM!. Use a supported basis code from 0 through 4.G9, maturity entered as TBD: Returns#VALUE!. Replace the placeholder with a valid maturity date.
The premium-price comparison in G7 returns -0.987%. Paying 100.25 to receive 100.00 produces a loss, so the negative yield is valid behavior.
The fraction-of-face mistake in G8 returns 39584.628%. Its price is entered as 0.9895 while redemption remains 100.00, so the inputs use inconsistent scales.
For that mistaken row, correct the price to 98.95.
Tips & Common Mistakes
- Keep price and redemption on the same scale. The documented inputs are per $100 face value. Consistently scaled amounts also work, but mixing a fraction of face with a per-$100 redemption changes the result.
- Use whole-number basis codes. Excel truncates a decimal basis: 1.9 is treated as 1. Enter the intended code explicitly.
- Check redemption as well as price. A zero redemption value returns
#NUM!, even when the price and dates are valid. - Keep the spill area clear. In Example 6, enter the formula only in
B2and leave the remaining output cells empty so Excel can place the results. - Read the result label carefully. A simple annual yield, a compound annual yield, and a discount rate describe different calculations, even when their percentages look close.
Other Excel articles you may also like:
