If you want to know what a stream of future cash flows is worth in today’s money, the NPV function gives you that present value.
There’s one catch worth knowing up front. Excel assumes your first cash flow lands one period from now, so money you invest today has to be handled a little differently. Nothing to worry about, it’s easy once you see it.
NPV returns a single number, but it also drops neatly into dynamic array formulas. In this article, I’ll show you how to use NPV correctly, with practical examples.
NPV Function Syntax in Excel
The NPV function returns the net present value of a series of cash flows at a given discount rate.
=NPV(rate, value1, [value2], ...)
- rate – The discount rate for a single period.
- value1 – The first cash flow, or a range that holds your cash flows.
- [value2], … – Optional. Any further cash flows, if you didn’t pass them all as a range.
When to Use NPV Function
- Value a series of future cash flows in today’s terms.
- Decide whether an investment is worth it, where an NPV above zero is a good sign.
- Compare two projects on an equal footing.
- Test how the result moves at different discount rates.
Example 1: Basic Net Present Value of Future Cash Flows
Let’s start with the simplest case, where every cash flow lands in the future.
Below is the dataset with five years of cash flows in column B and the discount rate in cell D2.
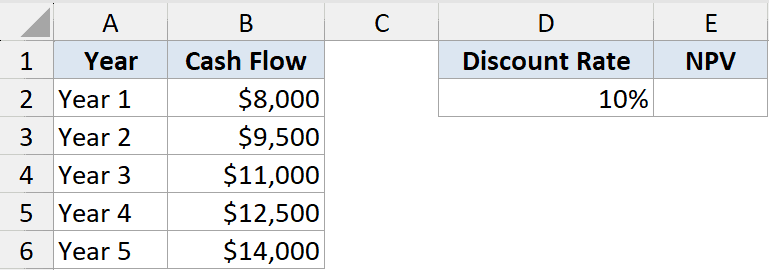
I want the present value of those five years of inflows, discounted at 10%.
Here is the formula:
=NPV(D2,B2:B6)
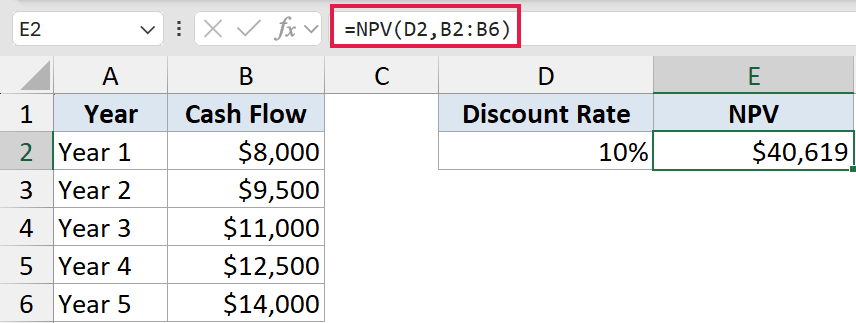
NPV discounts each cash flow back to today using the rate, then adds them up. The five inflows come out to about $40,619 in today’s money.
This works cleanly because every value sits one period or more in the future, which is exactly what NPV expects.
Example 2: Include an Initial Investment at Year Zero
This is the part that trips most people up, so it’s worth slowing down on.
Below is the dataset with an upfront investment in cell B2 (Year 0) and four years of returns below it.
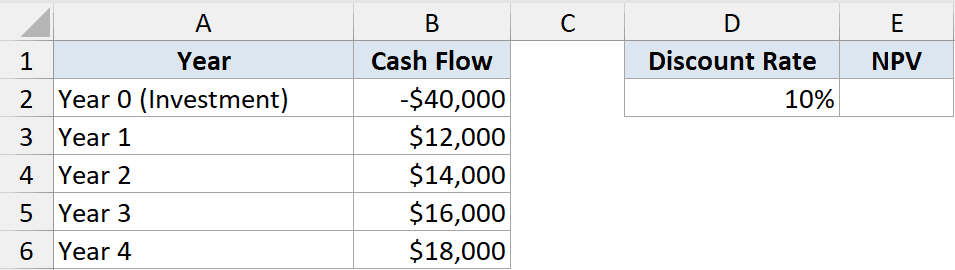
I want the net present value, accounting for the money I spend today.
Here is the formula:
=NPV(D2,B3:B6)+B2
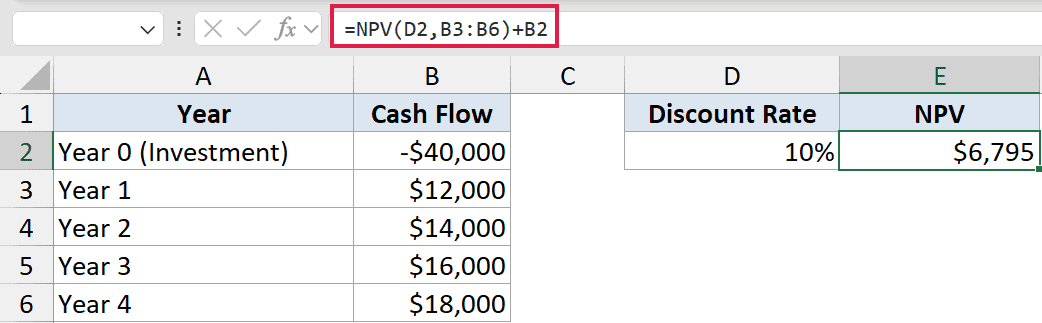
The trick is that NPV treats its first value as one period away, not as today. So I leave the Year 0 investment out of the NPV range and add it back on at the end.
Because the investment happens right now, it needs no discounting. Adding B2 outside the function keeps it at full value, giving a net present value of about $6,795.
Pro Tip: Never include a Year 0 amount inside the NPV range. Keep the future cash flows in the function and add the upfront amount outside it, or your result will be discounted by one period too many.
Example 3: Compare Two Investments by NPV
NPV really earns its keep when you’re choosing between options.
Below is the dataset with two projects side by side, each with an upfront cost and four years of returns.
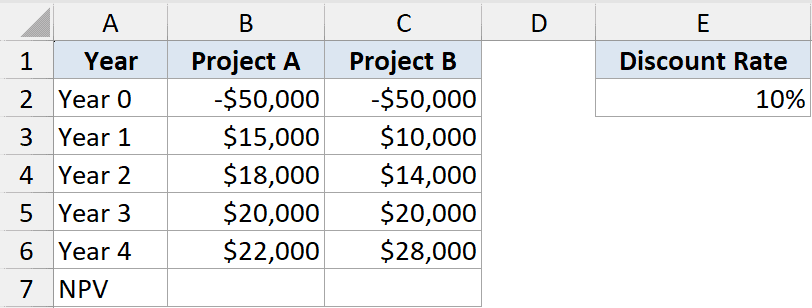
I want the net present value of each project so I can see which one is the better bet.
Here is the formula for Project A:
=NPV(E2,B3:B6)+B2
And the same approach for Project B:
=NPV(E2,C3:C6)+C2
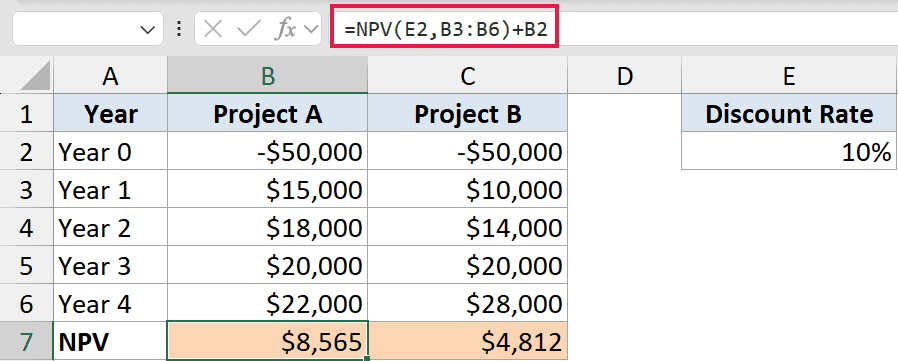
Both formulas discount the future returns and add back the Year 0 cost, just like the last example. Project A comes out around $8,565 and Project B around $4,812.
Even though both start with the same $50,000 outlay, Project A delivers its returns sooner, so it wins on present value.
Example 4: Discount Monthly Cash Flows
NPV works on any period length, as long as the rate matches the period.
Below is the dataset with six months of cash flows in column B and an annual rate in cell D2.
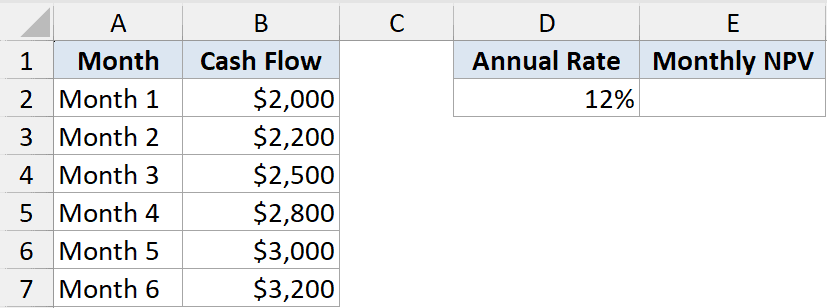
I want the present value of these monthly inflows using a 12% annual rate.
Here is the formula:
=NPV(D2/12,B2:B7)
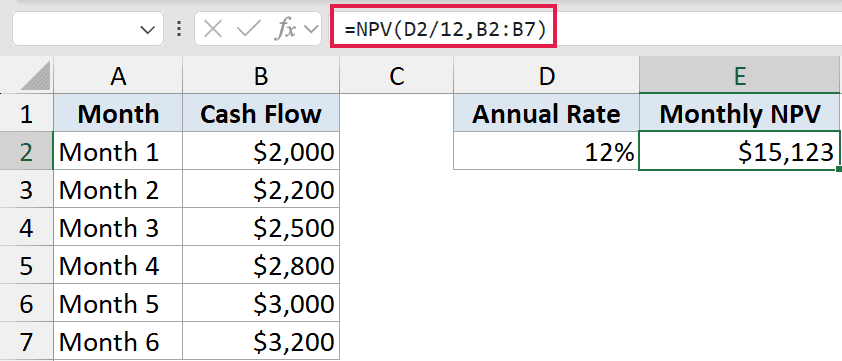
The cash flows are monthly, so the rate has to be monthly too. Dividing the 12% annual rate by 12 gives the per-month rate NPV needs.
Mismatching the rate and the period is a common error. Monthly cash flows always need a monthly rate.
Example 5: Build an NPV Sensitivity Table
A single NPV is useful, but seeing how it shifts with the rate is even better.
Below is the dataset with a column of discount rates in column A and a fixed set of cash flows in column E.
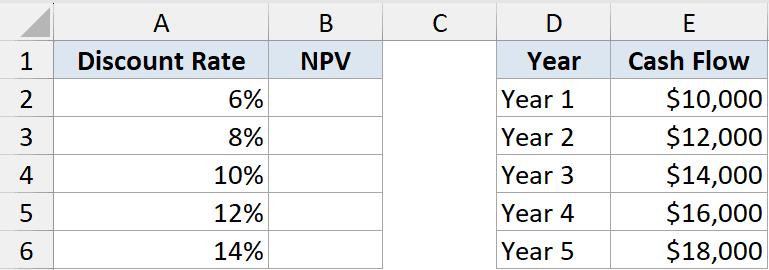
I want the NPV of the same cash flows at each discount rate, so I can see how sensitive the result is.
Here is the formula:
=NPV(A2,$E$2:$E$6)
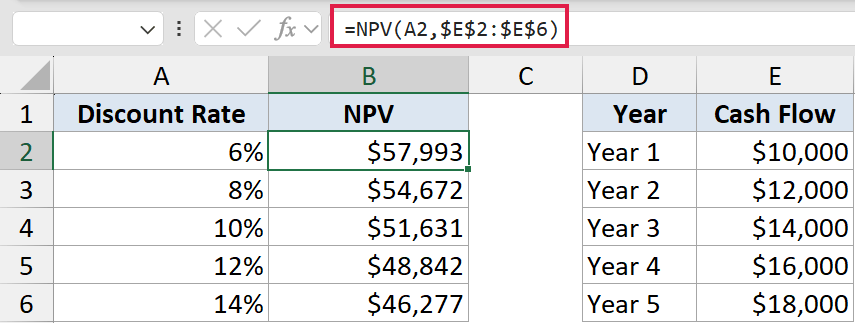
I locked the cash flow range with dollar signs so it stays fixed, then filled the formula down against each rate in column A.
As the rate climbs from 6% to 14%, the NPV falls from about $57,993 to $46,277. Higher discount rates shrink the value of future money, which is exactly what you’d expect.
Tips & Common Mistakes
- The first value is one period out. NPV assumes value1 arrives one period from now, not today. Add any Year 0 amount outside the function.
- Match the rate to the period. Monthly cash flows need a monthly rate, quarterly flows need a quarterly rate, and so on.
- NPV is not the same as XNPV. If your cash flows aren’t evenly spaced in time, use XNPV with actual dates instead.
- It composes with dynamic arrays. You can feed NPV a filtered or spilled range, like
=NPV(rate, FILTER(...)), to value just part of a cash-flow stream.
NPV is one of the most useful finance functions in Excel once you respect its timing rule. Keep your future cash flows inside the function, handle the upfront amount separately, and match the rate to the period.
Get those three things right and NPV will give you a reliable read on what any cash-flow stream is really worth today.
Related Excel Functions / Articles: