How to Calculate Age in Excel From Date of Birth
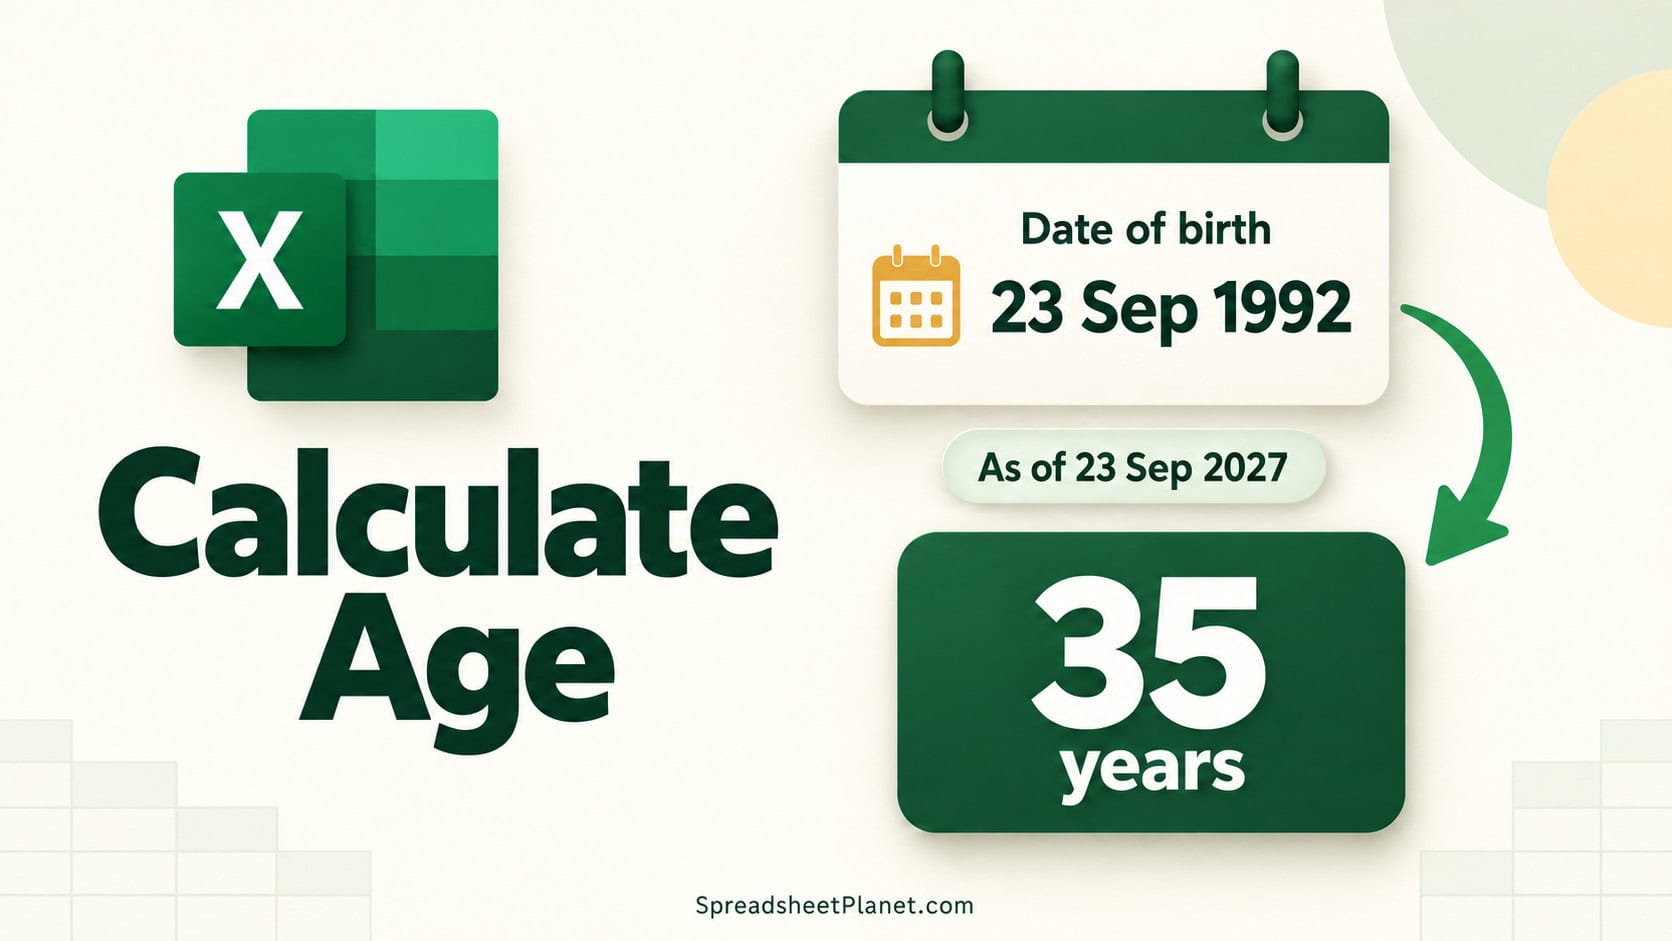
Working out someone’s age from their date of birth sounds like simple subtraction, but it isn’t. A person born in December isn’t a year older until December comes around. Excel …

 Steve Scott
Working out someone’s age from their date of birth sounds like simple subtraction, but it isn’t. A person born in December isn’t a year older until December comes around. Excel …
An annuity is a series of equal payments made at regular intervals, like a monthly payout from a retirement annuity or a fixed deposit into a savings plan. Excel handles …
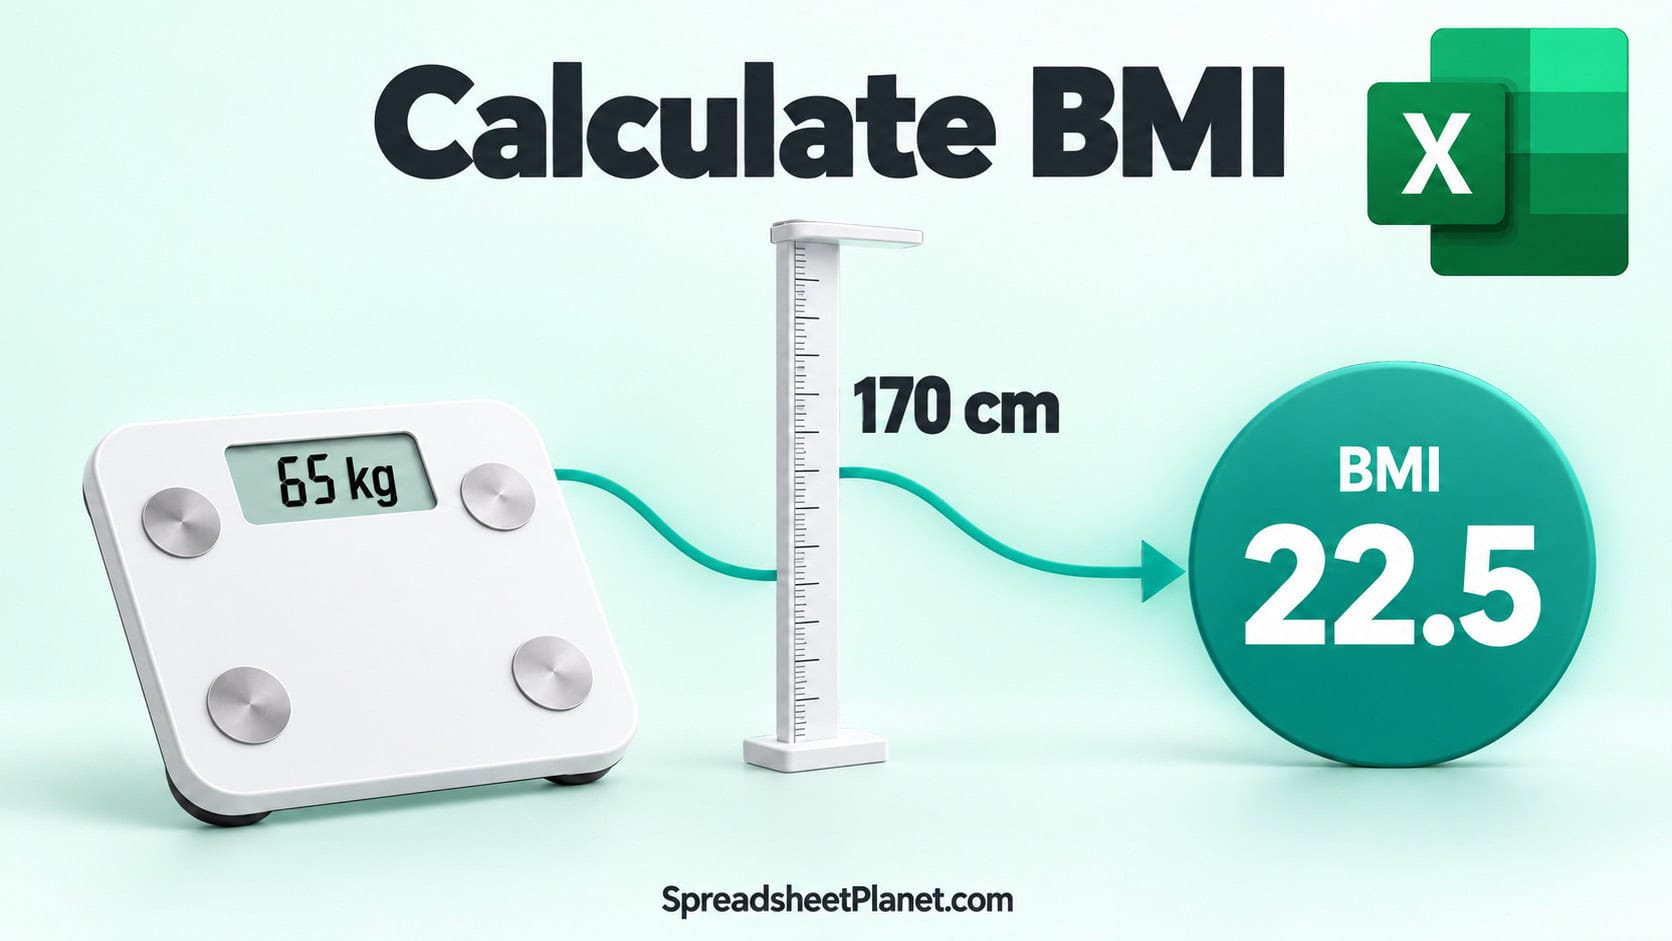
BMI (body mass index) compares someone’s weight with their height, and Excel can work it out for a whole list of people with one short formula. The tricky part is …
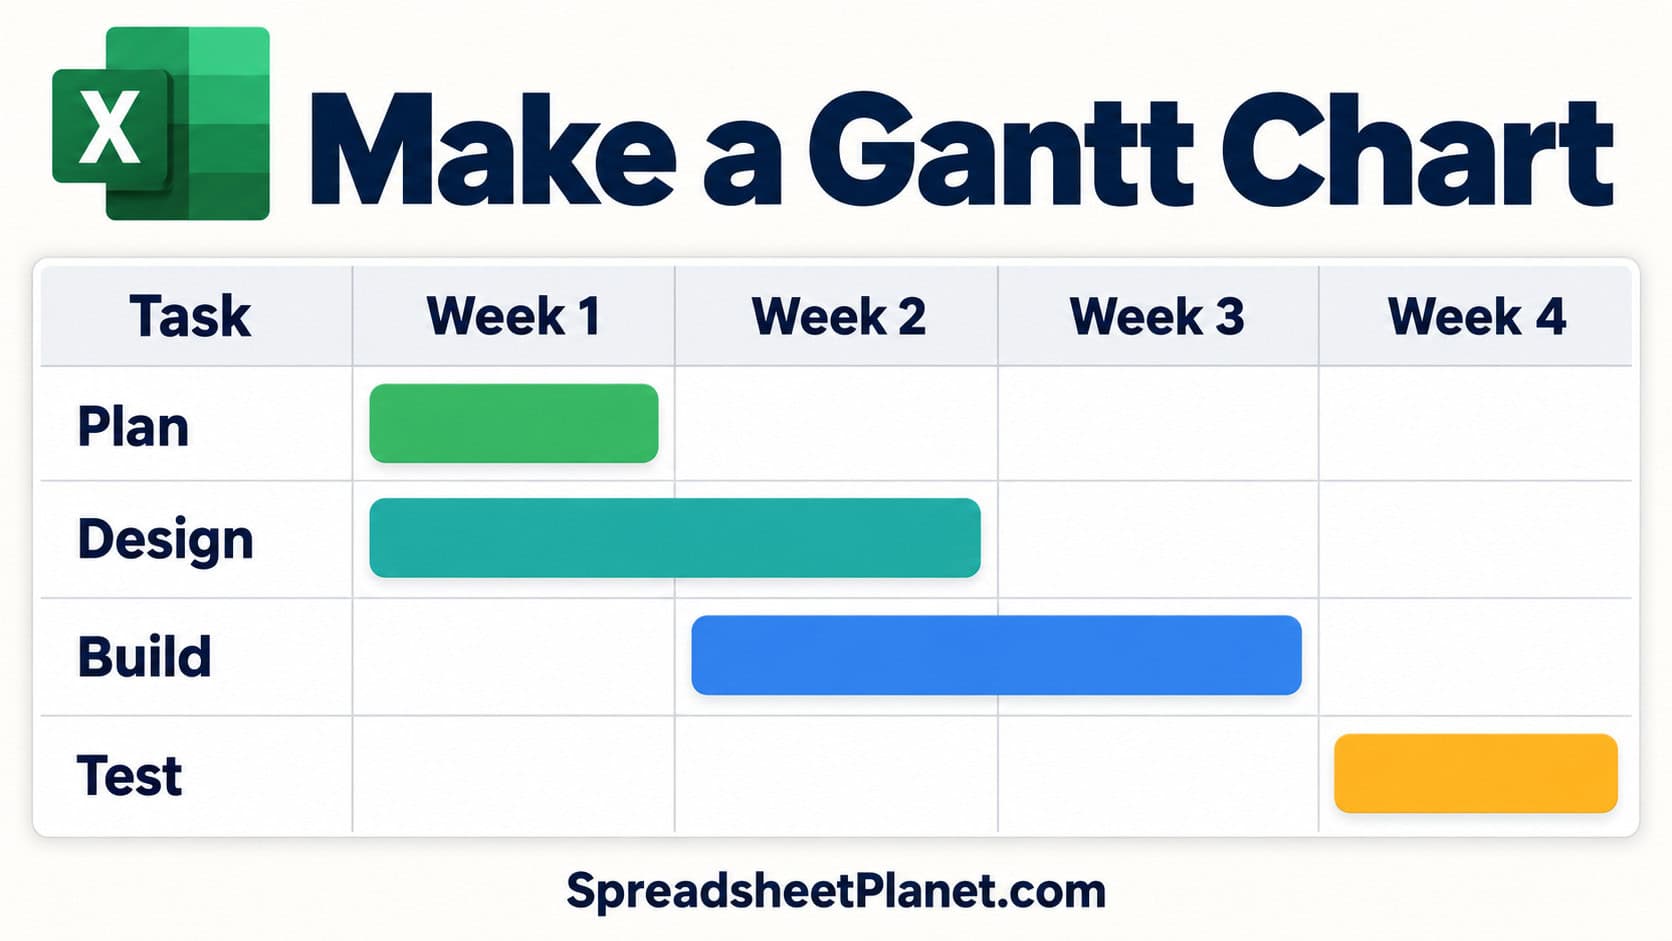
A Gantt chart in Excel shows every task in a project as a bar on a timeline. You can see what starts when, what overlaps, and when the project wraps …
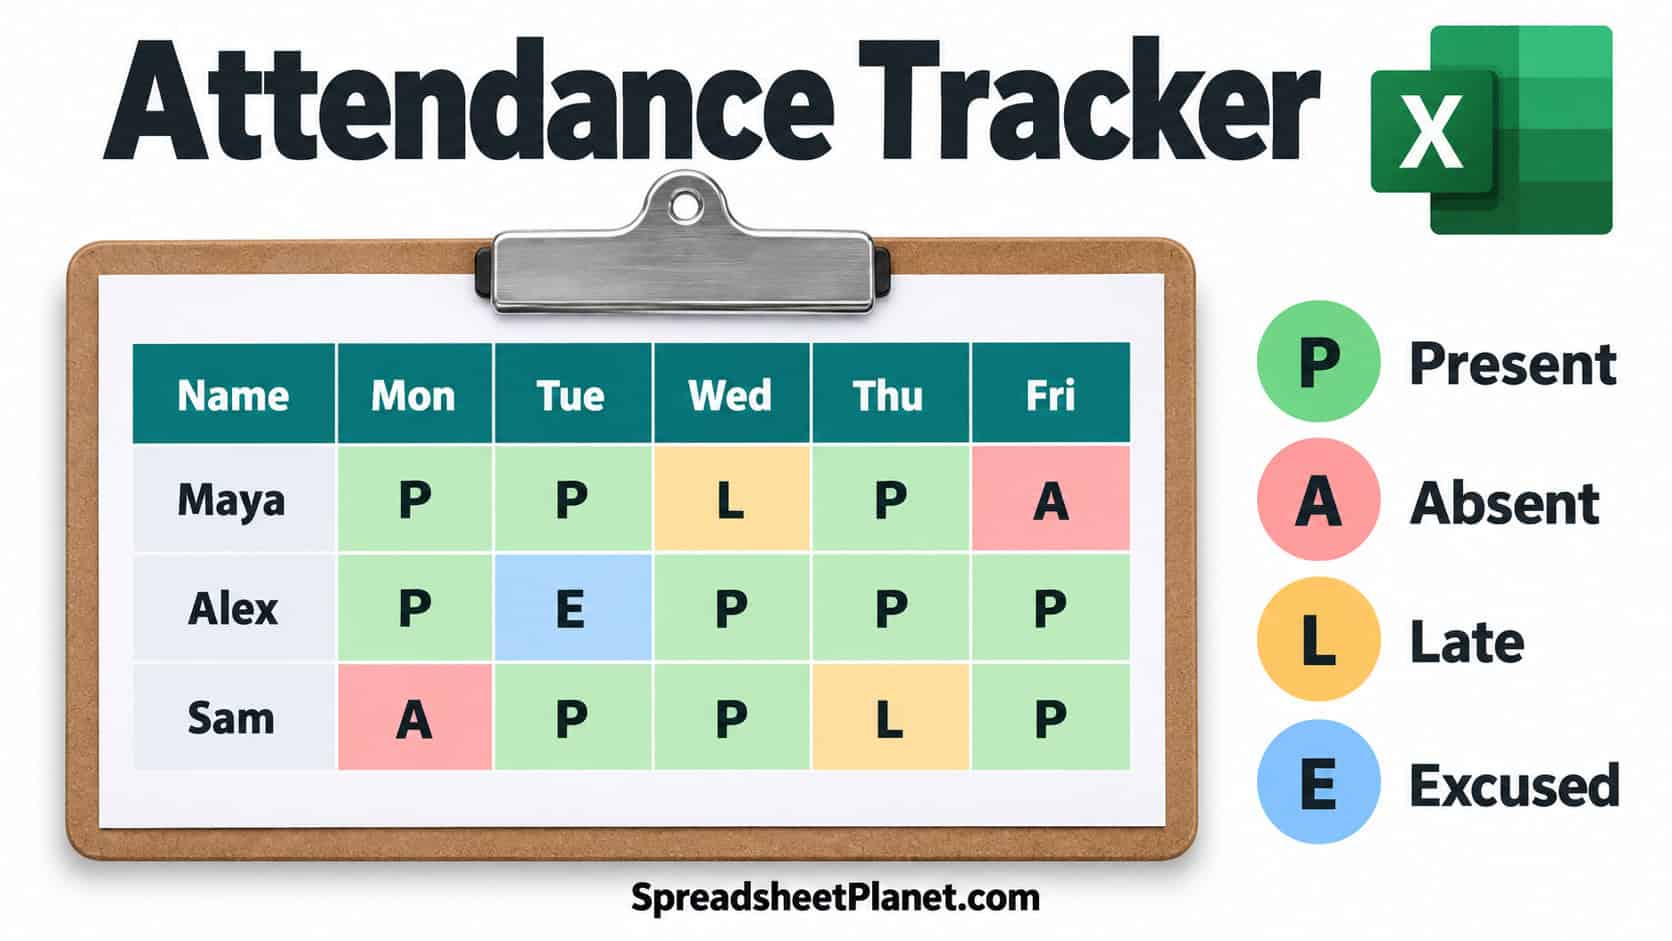
An attendance tracker in Excel lets you mark who was present, late, absent, sick, or excused each day, then turns those marks into totals and an attendance percentage. Setting up …

VLOOKUP from another sheet is what you need when your prices or product details live on one tab and the rows you’re filling in live on another. The lookup works …

If you want to know how many words are in a cell, Excel won’t tell you the way Word does. There’s no word count button and no WORDCOUNT function. What …

A dynamic named range in Excel is a name that grows with your data, so a formula, drop-down list, or chart that uses it picks up new rows automatically. A …
Structured references in Excel let a formula use a Table’s name and column headers, like Sales[Amount], instead of cell addresses such as C2:C9. They make formulas easier to read. They …
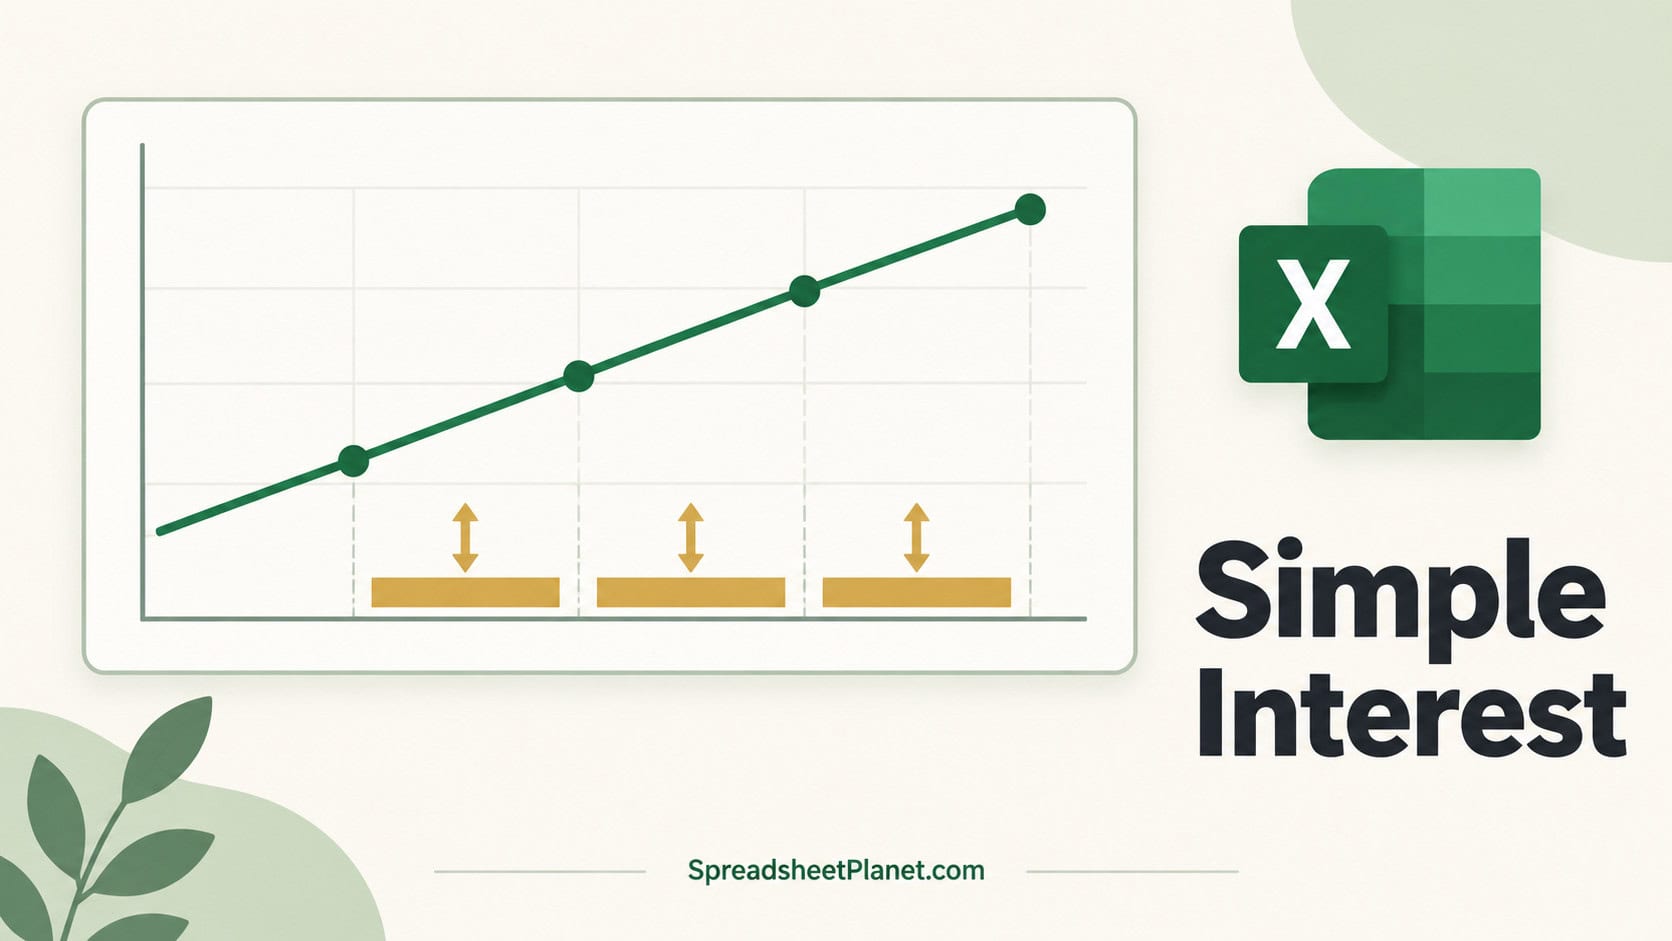
Simple interest is the easy kind of interest to work out in Excel. You multiply the principal by the annual rate and the time, and interest is only ever charged …

A timesheet in Excel looks simple until real shifts show up. There’s a lunch break in the middle, a shift that ends after midnight, and a week that runs past …
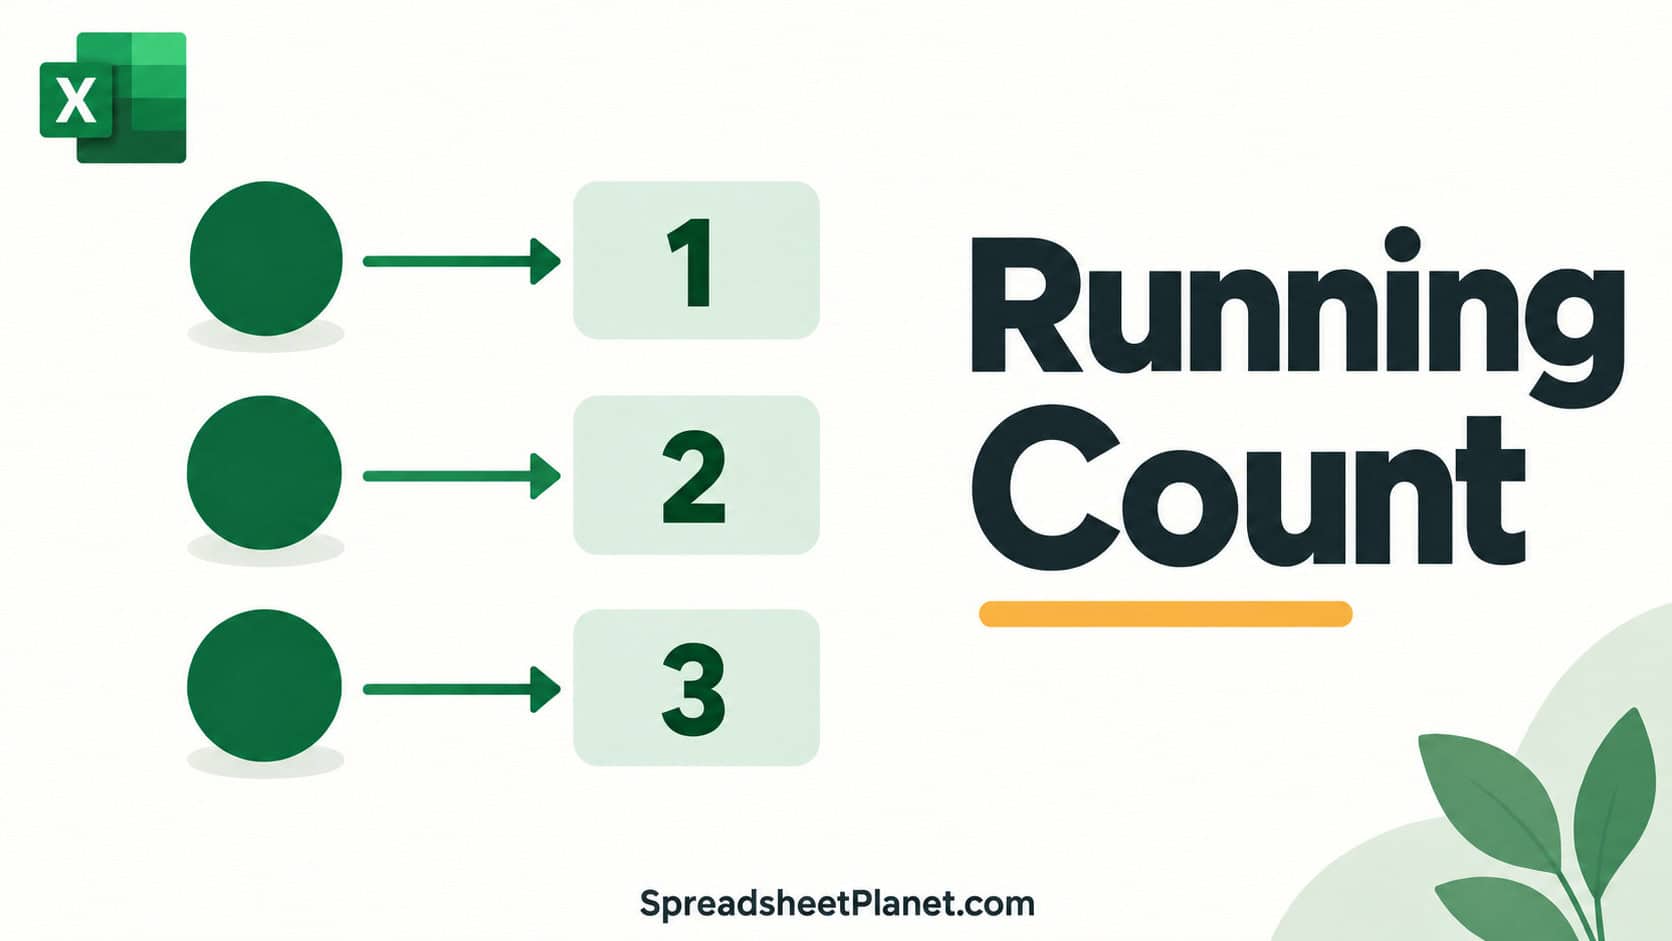
A running count of occurrences numbers each repeat of a value as you go down a list. The first Billing ticket gets 1, the next one gets 2, and so …