
The UNIQUE function in Excel returns the distinct rows or columns from an array.
You can build a list of categories from repeated entries without changing the source. An optional setting returns only items that appear exactly once.
In this article, I’ll show you how to build sorted unique lists, count distinct values, and find entries that occur only once.
UNIQUE Function Syntax in Excel
The UNIQUE function returns the distinct values from a range or array.
=UNIQUE(array, [by_col], [exactly_once])
- array – The range or array you want the unique values from.
- [by_col] – Optional. FALSE (the default) compares rows. TRUE compares columns instead.
- [exactly_once] – Optional. FALSE (the default) returns every distinct value. TRUE returns only values that appear exactly once.
When to Use UNIQUE Function
- Pull a clean list of distinct customers, products, or categories.
- Count how many different values a column holds.
- Find one-off entries that show up only once.
- Feed a tidy list into a dropdown or another formula.
Example 1: Get a Unique List from a Column
Let’s start with the core job UNIQUE was built for.
Below is the dataset with a column of cities in column A, where several cities repeat.
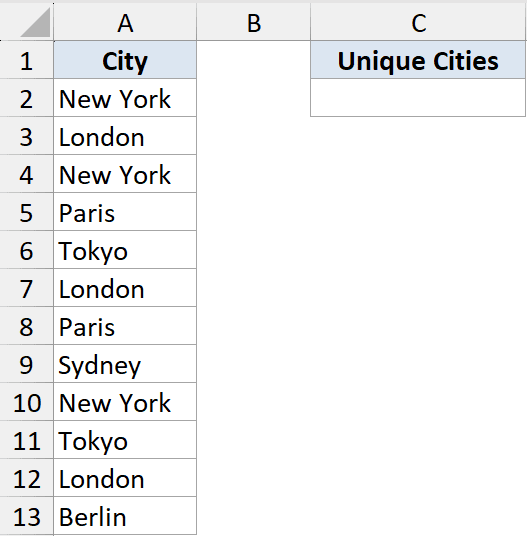
I want a list of each city just once, with the duplicates removed.
Here is the formula:
=UNIQUE(A2:A13)
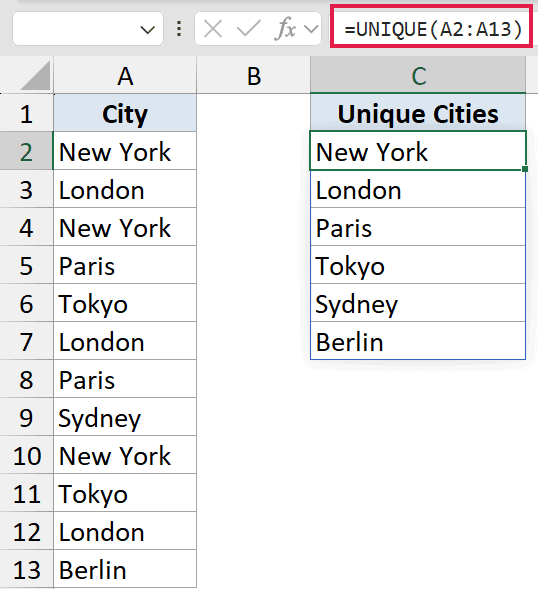
UNIQUE looks at the whole range and returns every distinct city. The result spills down from C2, so you only enter the formula once.
If you add or change a city in column A, the list updates on its own.
Example 2: Get a Unique List Sorted Alphabetically
A distinct list is even more useful when it’s in order.
Below is the dataset with department names in column A, again with repeats.
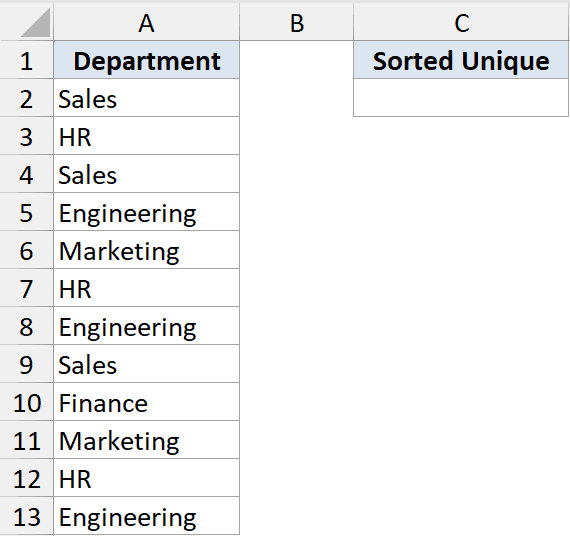
I want the distinct departments returned in alphabetical order.
Here is the formula:
=SORT(UNIQUE(A2:A13))
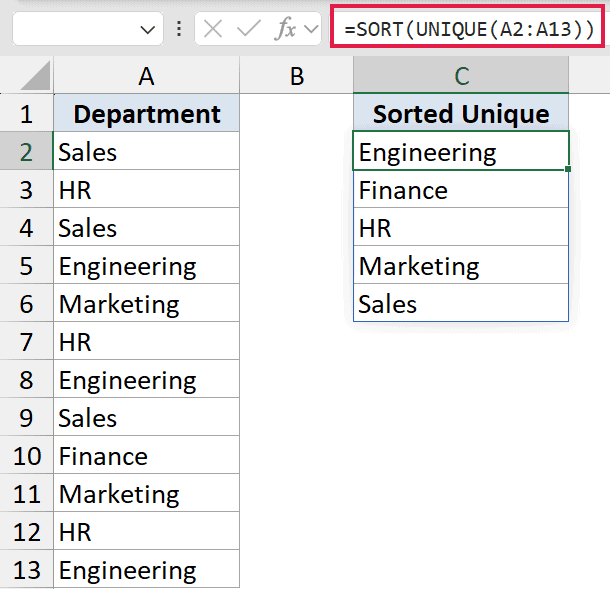
UNIQUE pulls the distinct departments first, then SORT arranges them A to Z. Because both functions spill, the combined result comes out as one clean, sorted list.
Pro Tip: UNIQUE and SORT pair up constantly. Wrap UNIQUE inside SORT whenever you want the distinct list ordered rather than left in its original sequence.
Example 3: Count How Many Unique Values There Are
Sometimes you don’t need the list itself, just how many distinct values exist.
Below is the dataset with a column of product names in column A.
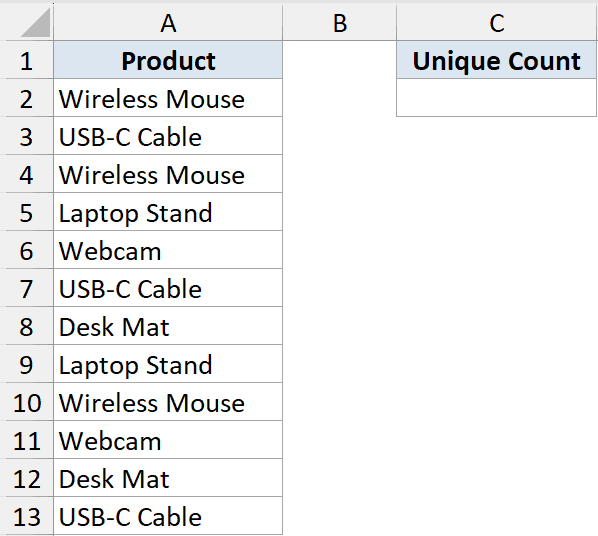
I want a single number telling me how many different products appear.
Here is the formula:
=COUNTA(UNIQUE(A2:A13))
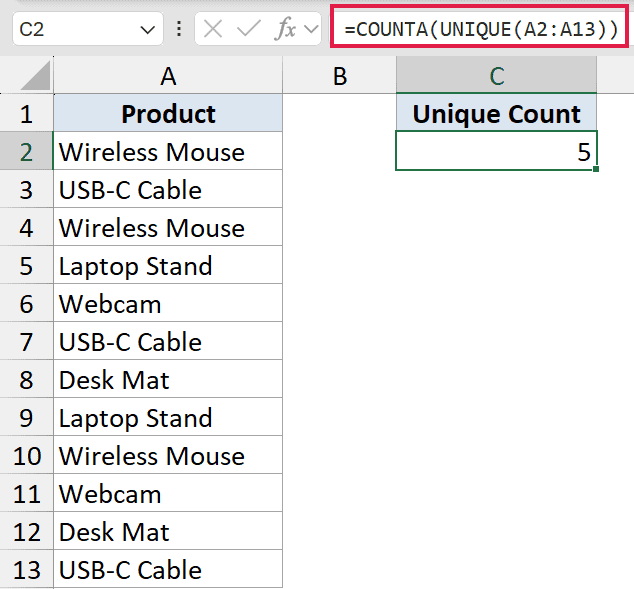
UNIQUE returns the distinct products as a spilled list, and COUNTA counts how many items are in that list. Together they give you the unique count in one cell.
This is a clean way to answer “how many different X do we have” without a helper column.
Example 4: Find Values That Appear Only Once
UNIQUE has a third argument that changes what counts as unique.
Below is the dataset with a list of email addresses in column A, where some addresses repeat.
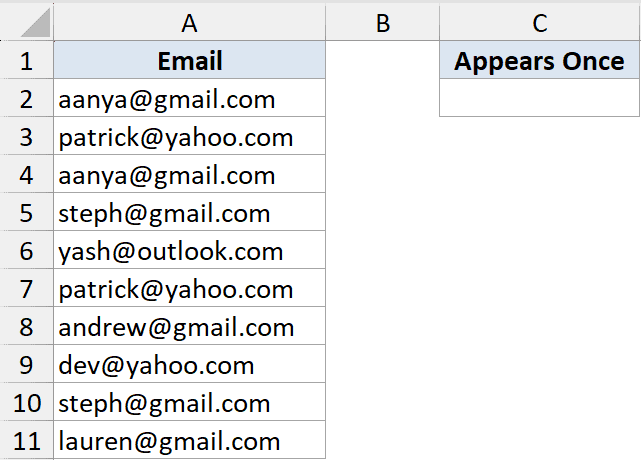
I want only the emails that appear exactly once, not the ones that show up more than that.
Here is the formula:
=UNIQUE(A2:A11,,TRUE)
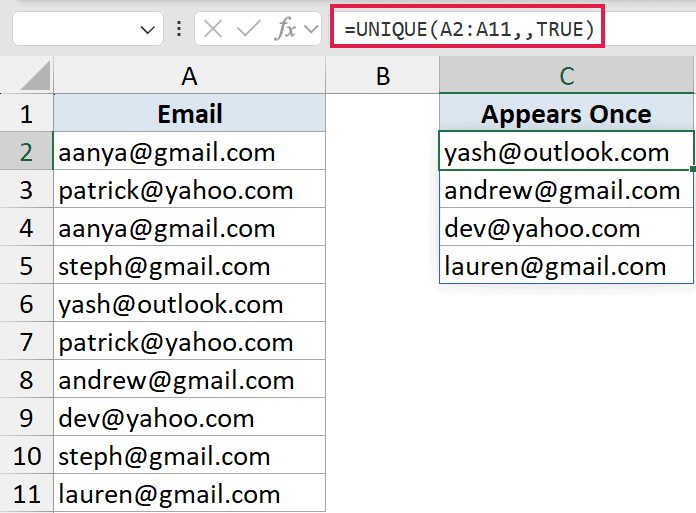
Setting the third argument to TRUE tells UNIQUE to return values that occur a single time only. Any address that repeats is dropped entirely.
Notice the two commas in a row. That’s me skipping the middle argument and leaving it at its default.
Example 5: Get Unique Rows Across Multiple Columns
UNIQUE isn’t limited to a single column. It can dedupe whole rows.
Below is the dataset with products in column A and regions in column B, where some product and region pairs repeat.
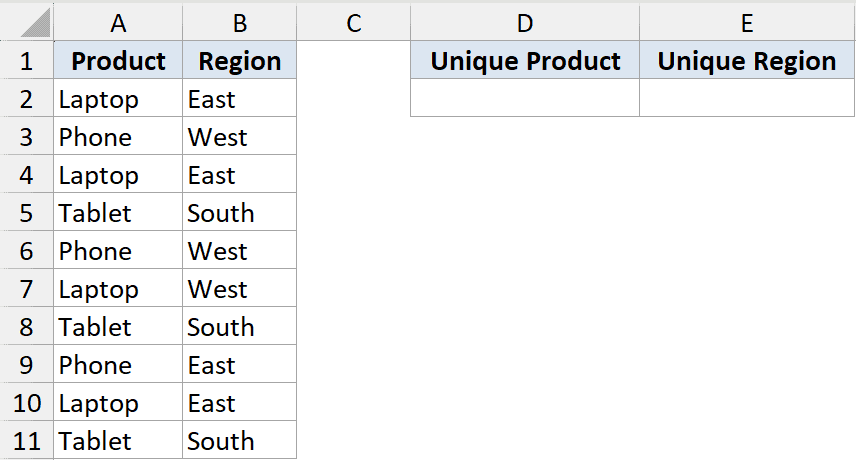
I want each distinct product and region combination, treating the two columns together.
Here is the formula:
=UNIQUE(A2:B11)
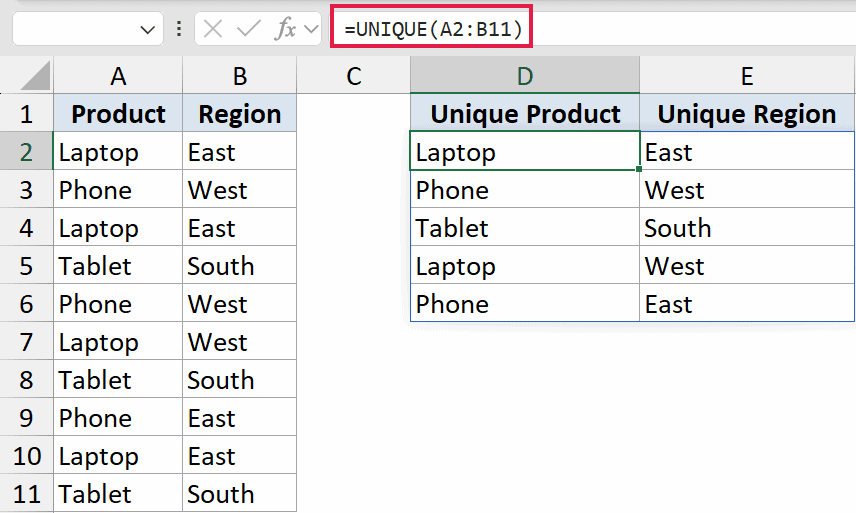
When you feed UNIQUE a two-column range, it compares entire rows. A row is only a duplicate if both the product and the region match another row.
The result spills as two columns, keeping each unique pair side by side.
Tips & Common Mistakes
- #SPILL! means the path is blocked. UNIQUE needs empty cells below to spill into. If something is sitting in the way, clear it and the result appears.
- Whitespace counts. “Sales” and “Sales ” with a trailing space are treated as different values. Clean your data with TRIM if stray spaces are splitting your list.
- by_col is for horizontal data. If your values run across a row instead of down a column, set the second argument to TRUE.
- Pair it with SORT and COUNTA. UNIQUE is rarely used alone. SORT orders the list, and COUNTA counts it.
UNIQUE turned what used to be a fiddly array formula into a single, readable step. Whether you need a distinct list, a count, or just the one-off entries, it handles it cleanly and updates itself as your data changes.
Give it a try on a messy column and watch the duplicates disappear.
Related Excel Functions / Articles:
- VSTACK Function in Excel
- How to Count Unique Values in Excel (Formulas)
- FILTER Function in Excel
- CHOOSE Function in Excel
- TRIM Function in Excel
- XLOOKUP Function in Excel
- MATCH Function in Excel
- INDEX Function in Excel
- List.Distinct Function (Power Query M)
- Table.Distinct Function (Power Query M)
- How to Remove Duplicate Rows based on one Column in Excel?
